
Squirrel Dashboard for SharePoint Archive Admins
8 min read · Last updated · Page version 17
The Squirrel Dashboard provides administrators with a real-time, high-level overview of the platform’s performance, system activity, and archiving impact. It’s designed to give actionable insights at a glance - helping you monitor data movement, track storage savings driven by your archive policies, and ensure Squirrel is running efficiently. For administrators new to the platform, the Getting Started guide covers initial setup before the dashboard becomes populated with data.
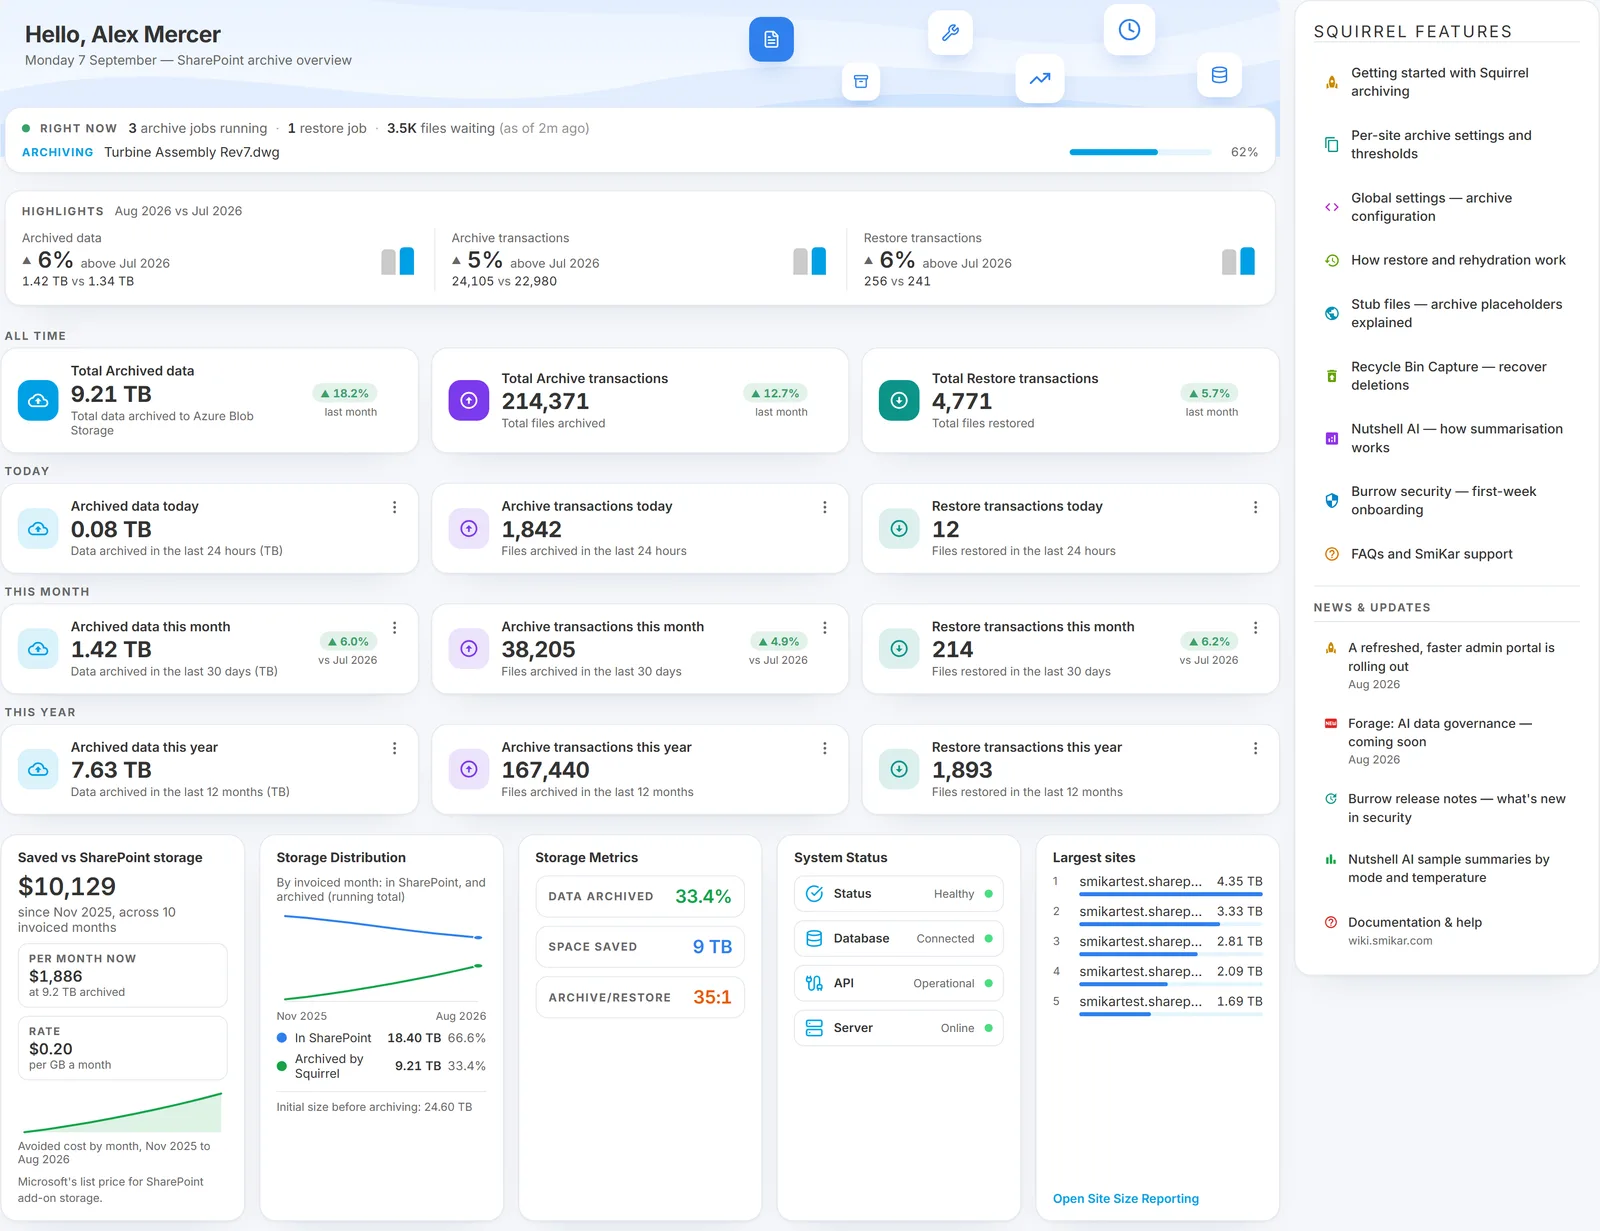
Once you have signed in with your administrator account, the main dashboard is the first screen you see.
What the Dashboard Shows You
Each widget is designed to display up-to-date metrics for archiving and restoring data across your SharePoint environment.
Key Metrics Displayed on the Dashboard:
-
Total Archived Data:
Displays the total volume of archived data (in terabytes). Useful for tracking the cumulative impact of your archiving policies and viewing what's been moved on the Archived Files page. -
Archived Data – Today / This Month / This Year:
Shows how much data has been archived over different time frames, helping you measure short- and long-term activity. -
Total Archive Transactions:
The number of files or items that have been successfully archived across all sites. -
Archive Transactions – Today / This Month / This Year:
Breakdowns of archiving activity by day, month, and year. -
Total Restore Transactions:
Displays the number of items restored from archive back into SharePoint. For detail on how rehydration works end-to-end, see the Restore Process page. -
Restore Transactions – Today / This Month / This Year:
Tracks how often users or admins restore files across your environment. -
Total Savings:
A real-time estimate of the storage cost savings achieved by archiving files to Azure Blob Storage instead of retaining them in SharePoint. -
Percent Archived:
Indicates what percentage of your SharePoint storage has been archived so far. This is a key metric to help you measure storage optimisation. -
Latest News:
Displays the most recent Squirrel announcements, updates, and new feature releases - keeping admins informed about what's new in the platform.
The live strip and month-over-month highlights
Two bands sit above the metric tiles.
Right now is the live line: how many archive jobs and restore jobs are running, how many files are waiting, and the file currently being processed with its progress. It is the quickest answer to "is anything actually happening", and it is the same information the Activity Monitor shows in full.
Highlights compares the current month with the previous one across archived data, archive transactions and restore transactions - naming both months and both figures, so you see "Archive transactions in Aug 2026 were 5% above Jul 2026 (24,105 vs 22,980)" rather than an unexplained arrow. The comparison is arithmetic on the invoiced monthly history, not a projection.
Each tile carries its own change against the previous period - an all-time tile compares with last month, a this-month tile with the month before - so the direction is on the tile rather than something you infer by opening it. The menu on each tile opens the fuller trend for that metric.
Jumping straight to a page
Press Ctrl+K (Cmd+K on a Mac) anywhere in the portal to open a Go to page box, then start typing. Results are grouped by section, arrow keys move through them, Enter opens the highlighted one and Escape closes without going anywhere. There is a matching button in the top bar if you would rather click than remember the shortcut.
It is faster than the sidebar once you know what you are after - "recyc" reaches Recycle Bin Capture in four keystrokes - and it is the quickest way to reach the analytics pages, which sit a level down from the main navigation.
Insights - what archiving is worth
Below the tiles, five cards answer the questions that get asked in budget reviews.
- Saved vs SharePoint storage - the money not spent on SharePoint add-on storage because the content is archived instead, totalled since your first invoice and stated across a named number of invoiced months. Alongside it: what that is worth per month at your current archived volume, and the rate used. The rate is Microsoft's list price for SharePoint add-on storage, which the card states on its face, so the figure is a like-for-like comparison against what Microsoft would charge rather than an internal estimate. A sparkline shows the avoided cost month by month.
- SharePoint without Squirrel - how large your SharePoint tenant would be today if nothing had been archived, against its actual size, with the percentage it is smaller by. This is the counterfactual version of the same story: not "we saved money" but "this is the tenant you would otherwise be administering".
- Largest sites - your top five sites by total size, each linking through to Site Size Reporting for its growth history. The fastest route from "the tenant is growing" to "these are the sites doing it".
For the fuller versions of these, see Analytics - particularly the Costs page, which plots the same saving month by month, and Billing History behind the invoiced figures.
The bottom row
Three cards close the overview.
- Storage Distribution - two lines on one scale, by invoiced month: what is still in SharePoint, and the running total archived. They are plotted together deliberately, because the useful picture is one falling as the other rises. The legend gives both as a figure and a share of the whole, and the card states the initial size before archiving began, which is the number both lines are measured against.
- Storage Metrics - the percentage of data archived, total space saved, and the archive-to-restore ratio, as three plain rows. The ratio is the same figure the Transaction Analysis page tracks over time; a high number means archiving is running well ahead of restores, which is the healthy pattern.
- System Status - whether Squirrel itself is healthy: the service, the database connection, the API, and the server. Check this first if the numbers elsewhere look stale, since a component that has stopped will show here before it shows anywhere else.
Dashboard Widgets Explained
Each metric appears in a widget-style tile designed for clarity and speed. These widgets are updated daily or in real-time (depending on the data type) and provide a live snapshot of the health and performance of your Squirrel environment.
You can use the dashboard to:
- Confirm if scheduled archiving is occurring as expected
- Quickly identify spikes in restore activity
- Measure storage reclaimed over time
- Track cost savings for reporting to stakeholders
- Stay updated on the latest platform improvements
If you're unsure about a specific widget or need help interpreting your dashboard data, reach out to support@smikar.com for assistance.
Common questions
Q: Why is my Squirrel dashboard showing zero archived data?
- A dashboard with zero archived data usually means no archive policy has run yet. Check your global settings to confirm a retention rule is enabled, and review site custom policies to make sure at least one SharePoint site is in scope. Newly installed deployments typically populate their first metrics after the next scheduled archive cycle.
Q: How often does the Squirrel dashboard refresh?
- Most widgets refresh on every page load against the live database, so metrics reflect activity in near real time. The "Latest News" widget pulls in updates as they're published. Storage-cost estimates (Total Savings) are recalculated daily because they depend on Azure tier pricing.
Q: Why is the Total Savings widget different from my actual Azure bill?
- The dashboard's Total Savings is an estimate based on the difference between SharePoint storage cost and Azure Blob Storage cost at standard pricing. Your actual Azure bill depends on the storage tier configured (
hot,cool, orcold), redundancy options, egress, and any enterprise discounts. Use the figure as a relative indicator rather than an exact bill match.
Q: Can I export the dashboard metrics for stakeholder reports?
- Yes - the Reports page provides exportable file, storage, and site-level reports that align with what's surfaced on the dashboard. For ad-hoc views, the Activity Monitor gives you transaction-level detail.
Q: I see archive transactions but no files in SharePoint have changed. Why?
- Squirrel logs an archive transaction the moment a file is moved from SharePoint to Azure Blob Storage; the file is replaced in-place with a small stub file that retains the original name and metadata. Users still see the file in SharePoint, but its content now lives in Azure.