
Reading the Evidence Box (Deterministic vs AI)
10 min read · Last updated · Page version 15
Every Burrow alert has the same two-part anatomy: deterministic evidence Burrow extracted from Microsoft's audit feed, and an AI narrative that explains the evidence in human terms. Understanding the boundary between the two is the difference between trusting Burrow's output and second-guessing it.
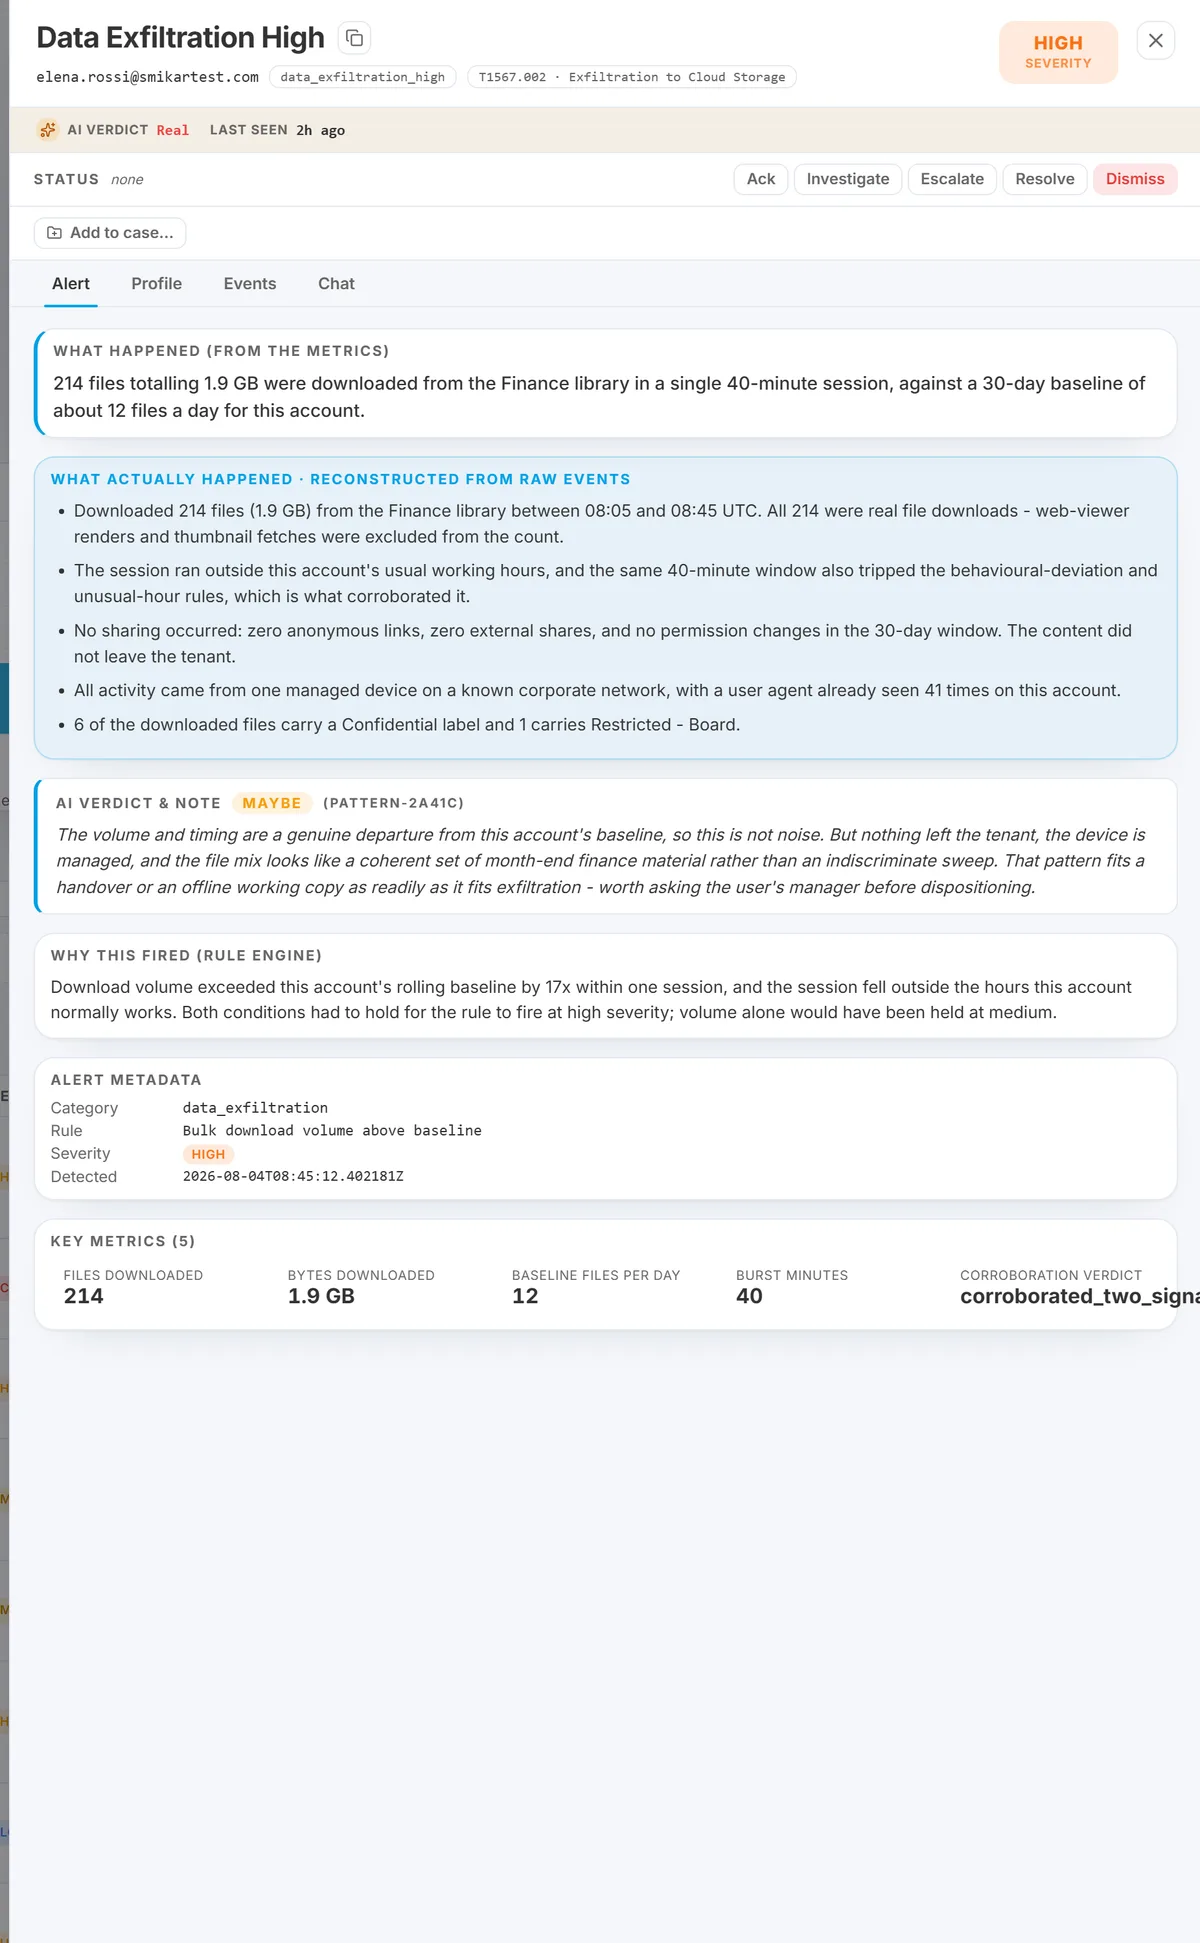
The drawer has four tabs, in the order you need them.
What's deterministic, what's AI
Burrow generates an alert by running rules over per-user counters. Everything in the alert's KEY METRICS table and TOP EVIDENCE section comes directly from those counters - exact counts, exact byte volumes, exact filenames, exact timestamps, exact geographies. None of it is generated.
The WHY THIS MATTERS narrative is AI-written. The AI reads the alert's deterministic evidence plus the user's behavioural baseline and writes 2–4 sentences explaining what's unusual.
Burrow's AI safety check verifies, before the narrative ever reaches your screen, that every number and every name in the narrative appears in the underlying evidence. If the AI introduces a fact that isn't there (a "hallucination"), the narrative is rejected and a plain deterministic template replaces it. So you can trust the numbers - they're either the real ones, or you're reading the template fallback (which is still correct).
Where the AI verdict surfaces. Beyond writing the narrative, the AI also records a YES / NO verdict on whether the alert looks genuine. A NO verdict (visible as the AI · NO badge on the row) now affects more than just whether the alert email was sent - it also files the alert under Dismissed in the Alerts page view, so the default Active queue stays focused on what still needs an operator. Operator override always wins: setting Acknowledged / Investigating / Escalated returns the alert to those tabs.
The trust hierarchy
The alert drawer is organised as a trust hierarchy - most trustworthy at the top. Read top-down and you can make a compliance-defensible call without ever having to trust AI prose. The AI is present as a hint; the ground truth sits above it.
- What happened (from the metrics) - a one-line deterministic headline built by code from the alert's key metrics. Not AI.
- What actually happened · reconstructed from raw events - the investigation digest. A plain-English reconstruction of the user's day, also built entirely by code. Not AI.
- AI verdict & note - the AI's judgment about whether this looks real (YES / NO / MAYBE), plus the "why this matters" narrative. Clearly labelled as AI, safety-checked so every number in the prose is real.
- Why this fired (rule engine), metadata, key metrics, evidence rows - the underlying supporting detail.
An analyst can always answer "who did what, to whom, when" from the top two cards. See the investigation digest article for what that second card actually reads like.
The screenshot above shows the hierarchy in the order listed: the deterministic headline first, the reconstructed digest second, the AI verdict (clearly badged, here MAYBE) third, and the rule-engine reasoning, metadata and key metrics beneath. Note that the AI card is the only one containing prose Burrow generated - everything above and below it is code-derived.
Anatomy of the drill drawer
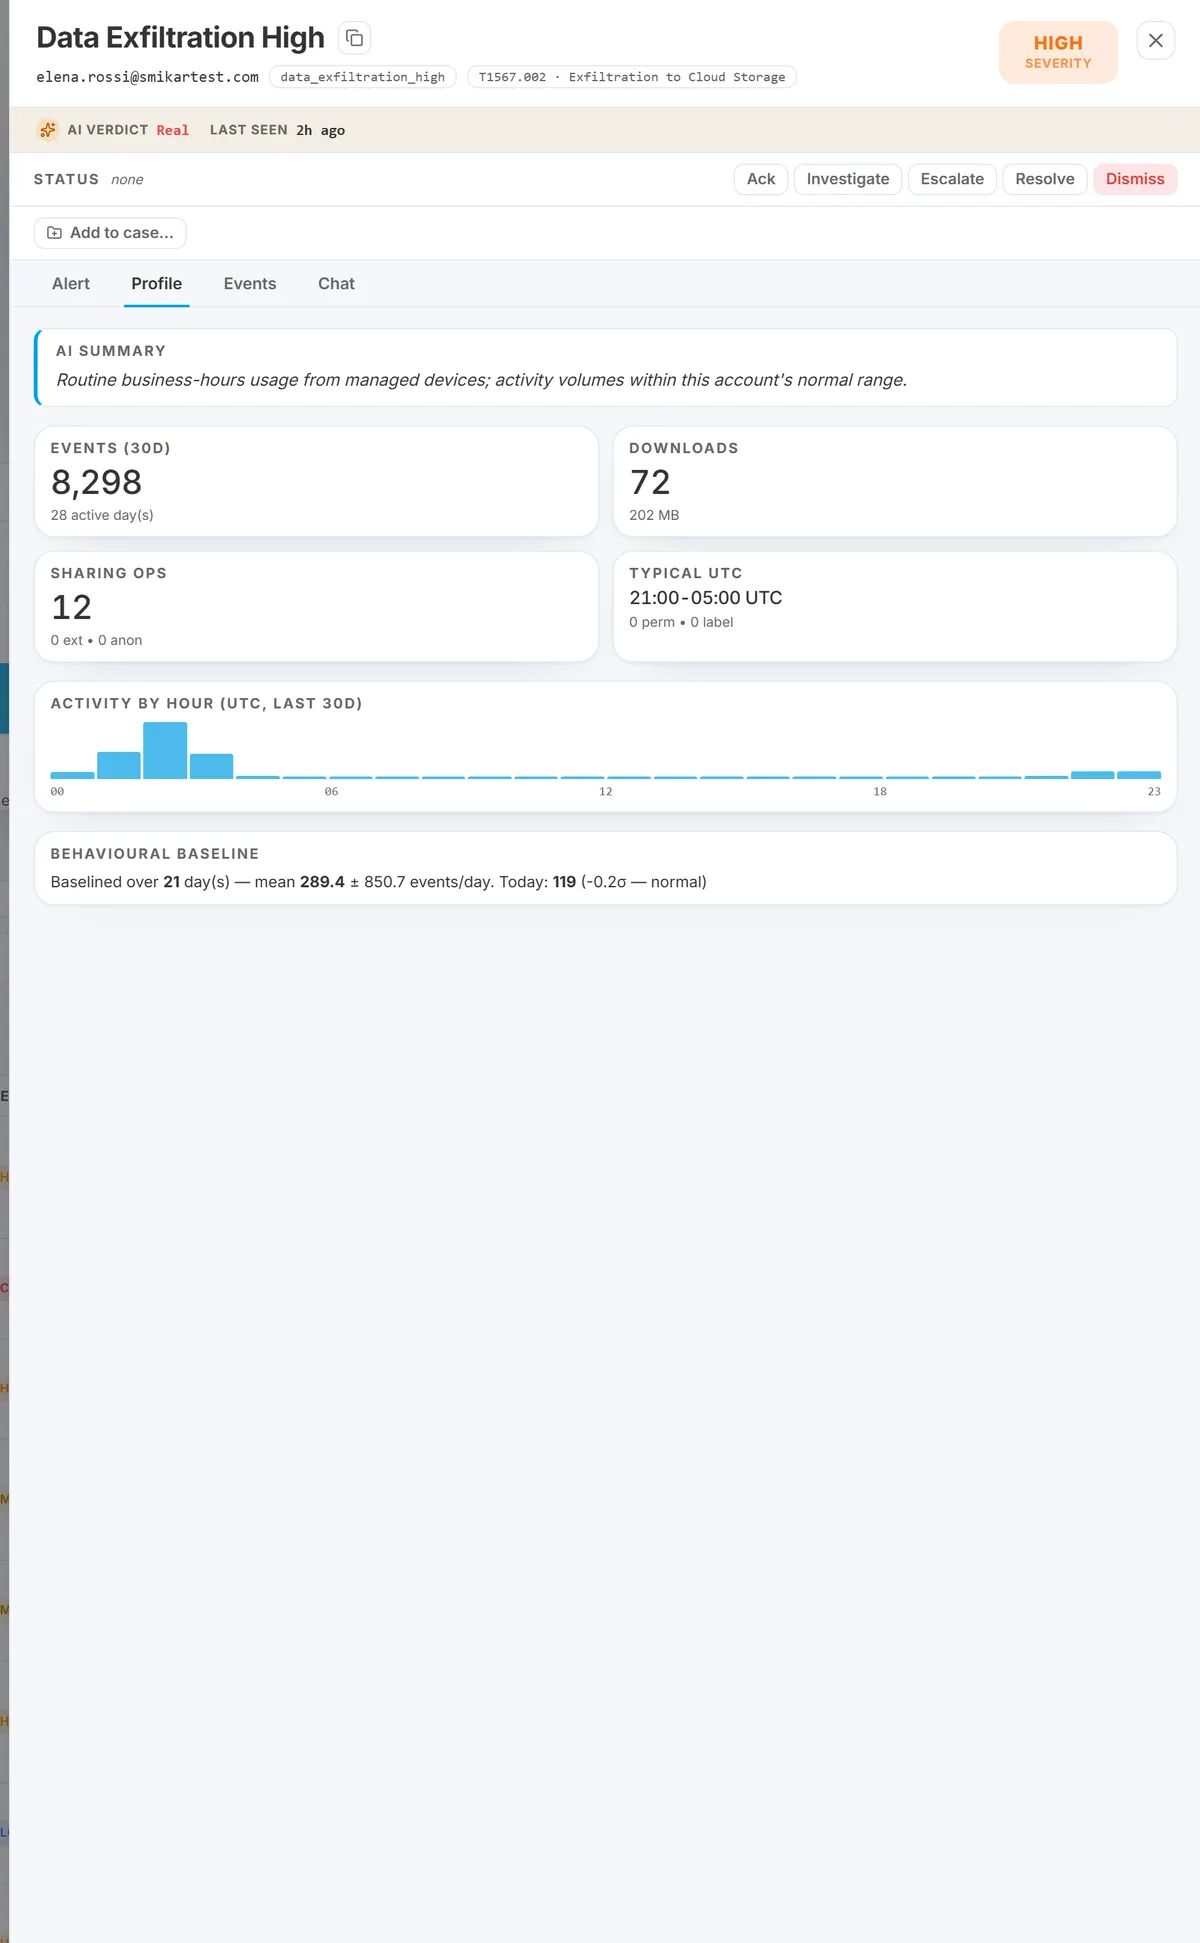
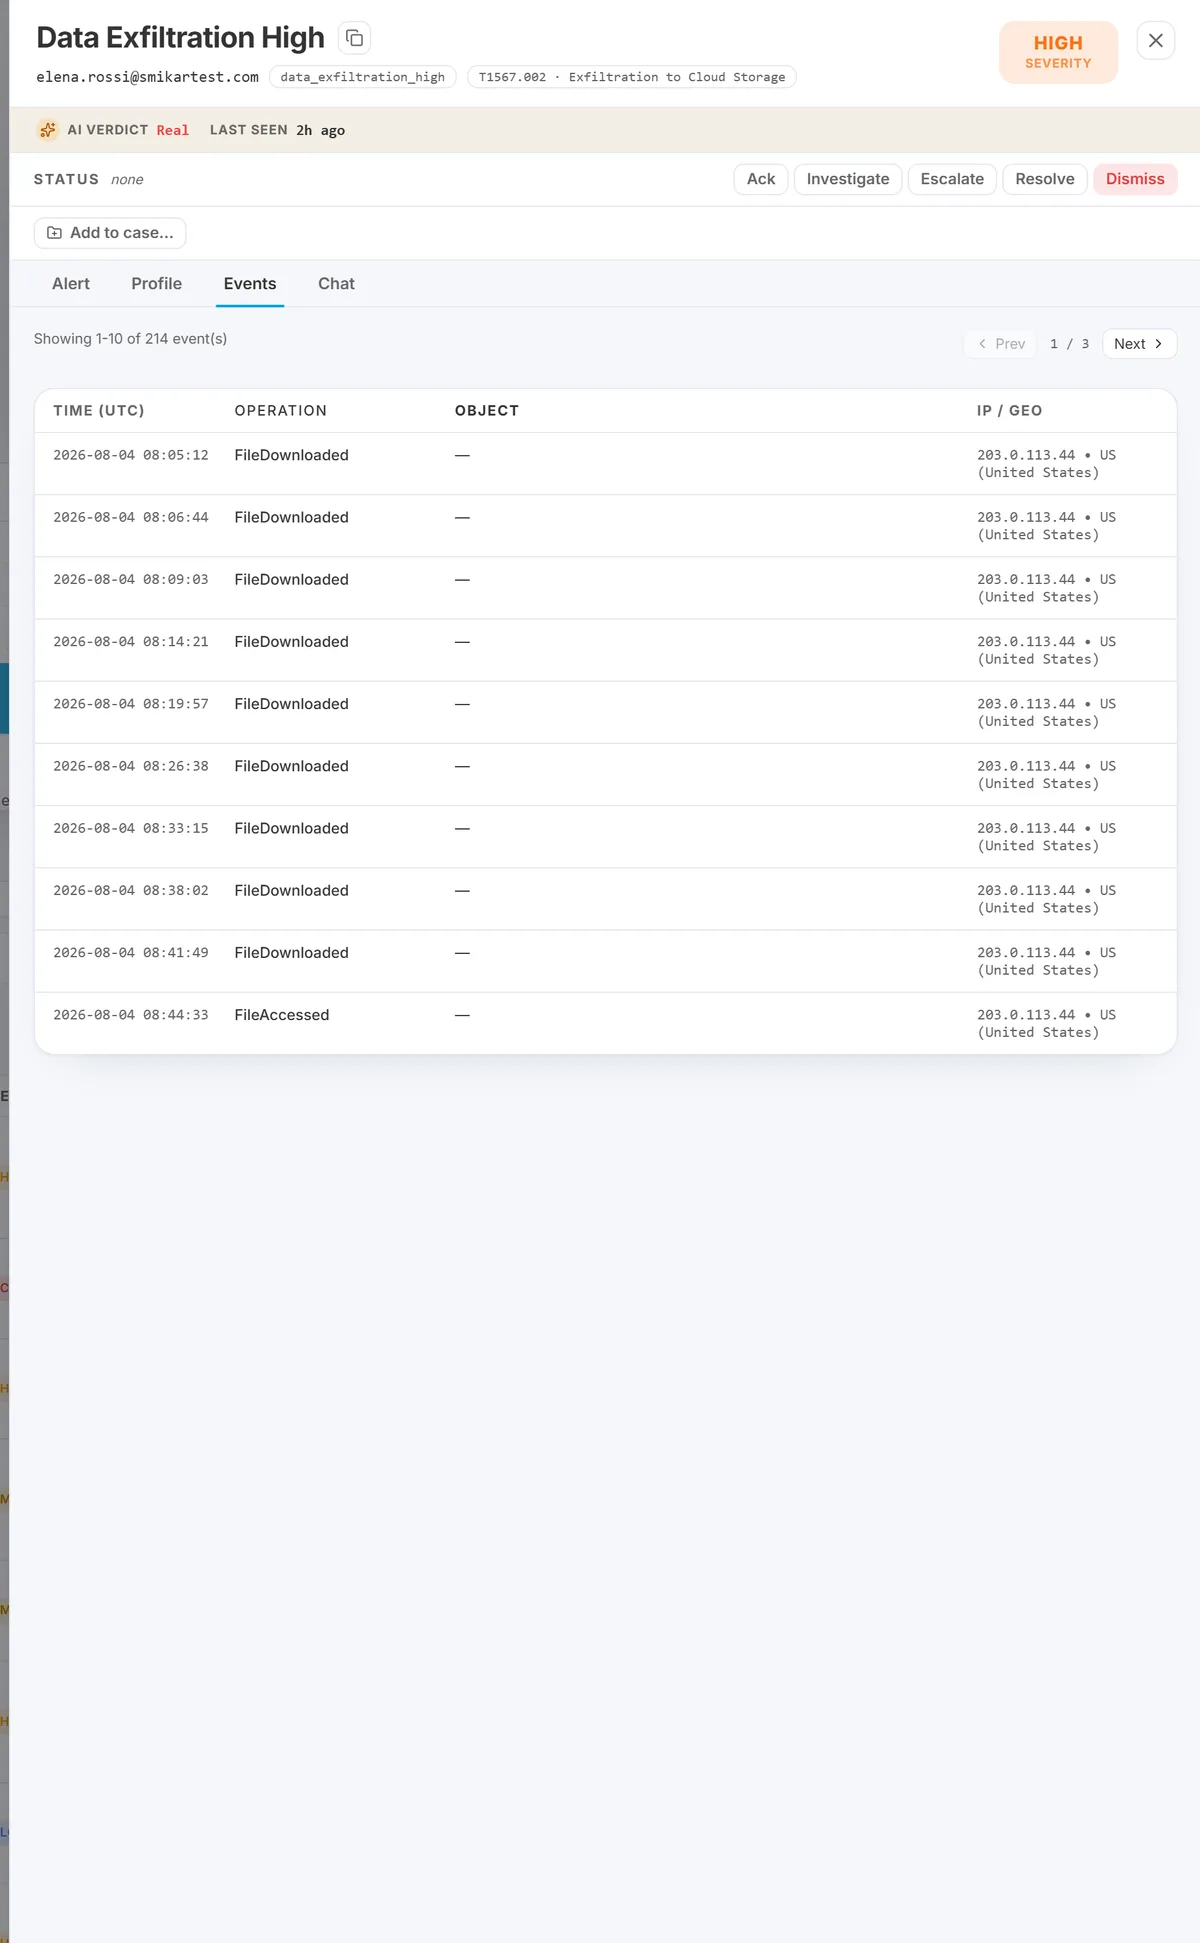
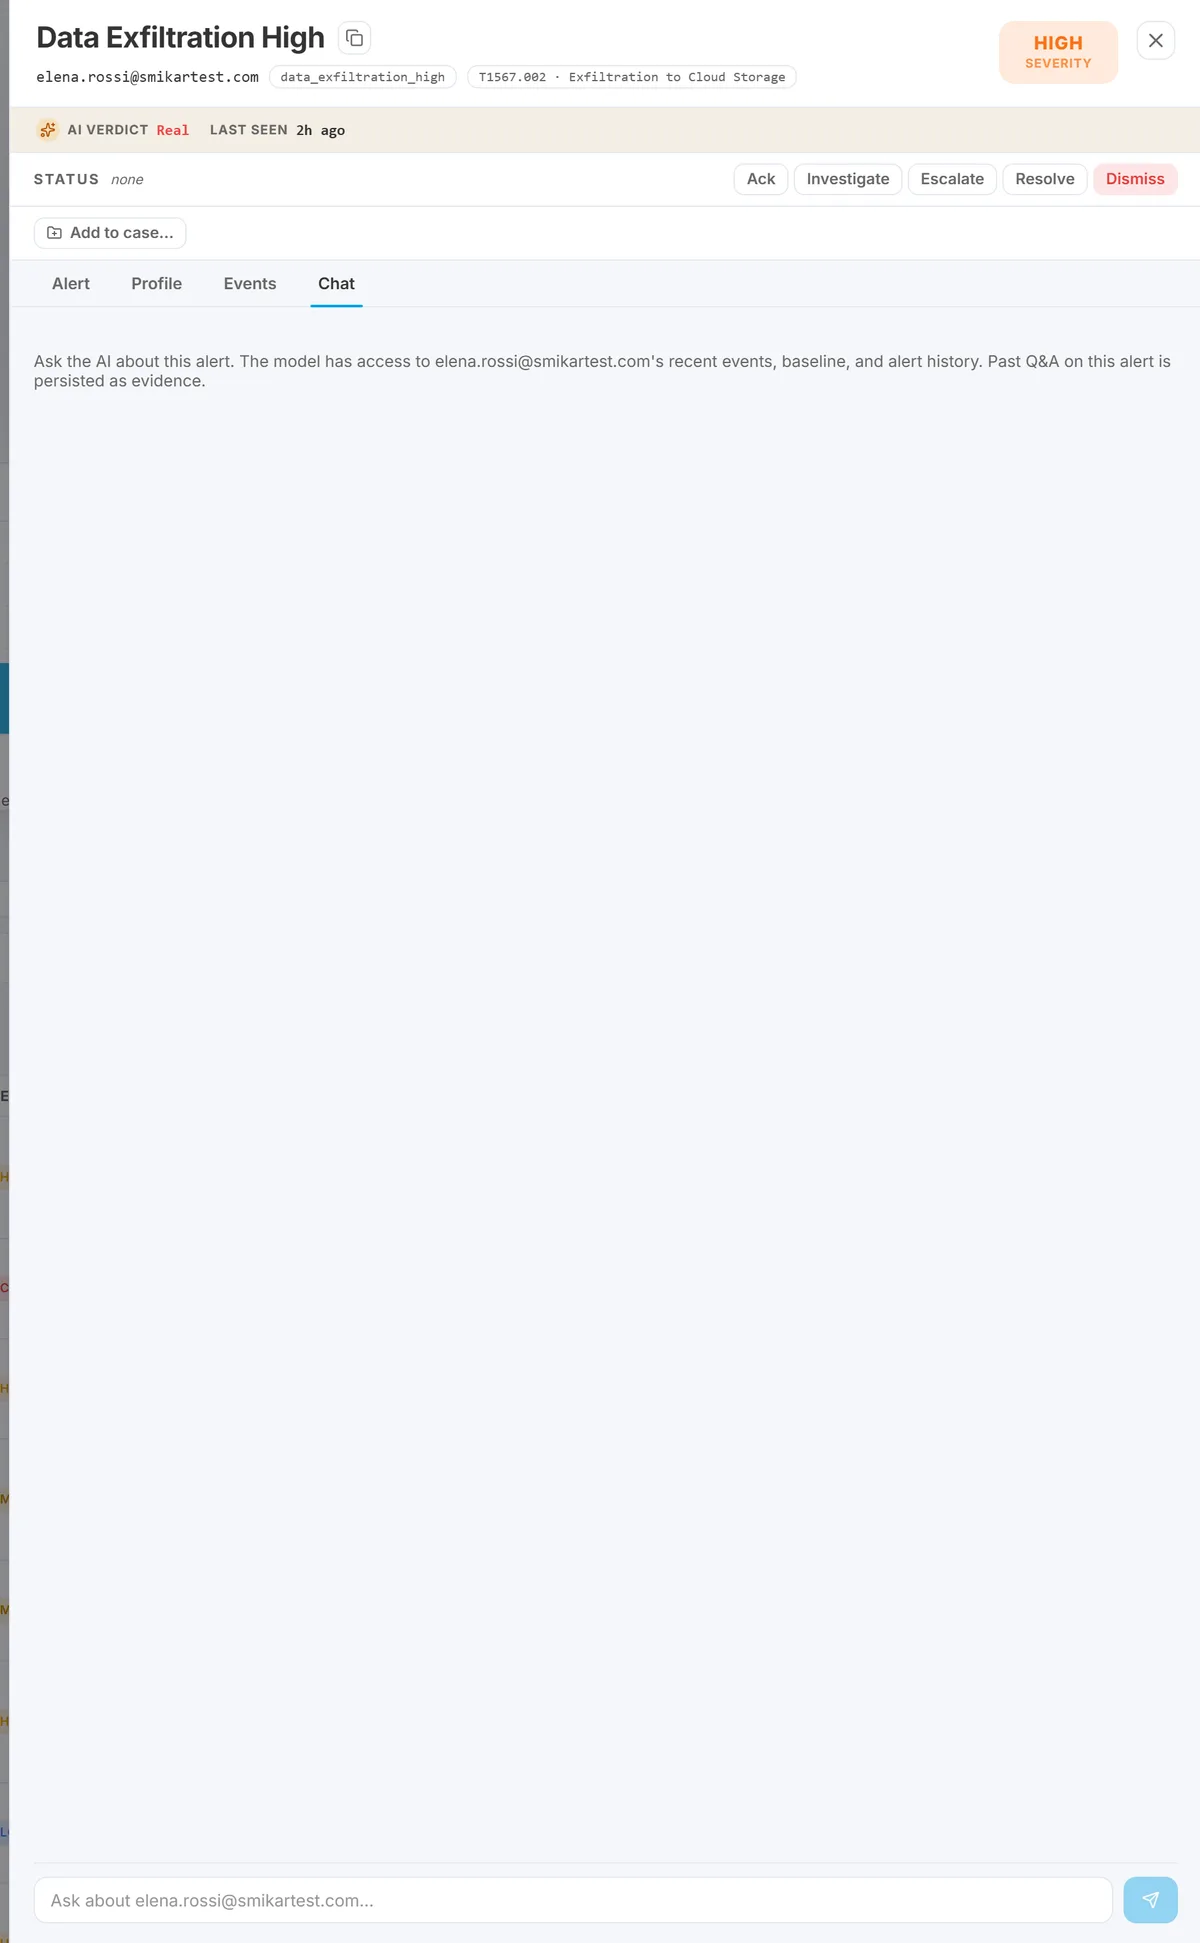
Click any alert row on the Alerts page. The drill drawer opens on the right with four tabs - Alert, Profile, Events, Chat - and the Alert tab is selected by default. The Alert tab is where the triggering evidence lives; the other three give you entity context after you understand what fired.
(When the drawer is opened from a non-alert row - a Hunt result, an Identity row, or a Top items entry - there is no Alert tab because there is no specific alert to show. You get Profile / Events / Chat only.)
Alert tab contents, top to bottom
1. What happened (deterministic headline)
A one-line summary built from the alert's key metrics. Something like "Downloaded 3.1 GB across 412 files from 2 sites (browser)". Not AI-written - this is code assembling a headline from the metrics grid so an operator has an instant read on what fired without scrolling.
2. What actually happened · reconstructed from raw events
The investigation digest - a bulleted plain-English reconstruction of the flagged user's UTC day so far, built by code from the raw audit events. Sharing recipients named directly, browser-viewer opens flagged as "not a download", bursts explained, machinery events counted separately. See the investigation digest article for full detail on what it covers and when to trust it.
Highlighted card, positioned above the AI verdict deliberately - the trust hierarchy puts deterministic reconstructions above AI prose.
3. AI verdict card
A coloured verdict badge - NO (green, "not real"), YES (red, "genuine signal"), or MAYBE (amber). Below it, the AI's "why this matters" narrative - the same safety-checked prose used in the email body. 2 to 4 sentences explaining what the rule caught and why it is unusual, clearly labelled as AI.
The AI now explains why THIS alert fired. The narrative is fed the rule's own exact trigger record - the concrete thing that crossed the threshold (the specific guest added, the sensitive term searched, the org-link count, the attempted usernames) - alongside a plain statement of what the rule catches. So the note states plainly why this alert tripped, not just a generic description of the category. It stays grounded: the AI is given those exact values, it does not invent them, and the same number-invention safety check and deterministic fallback still apply. This works across every alert type without a per-rule change, because the trigger record always names the concrete thing, even when the investigation digest did not happen to surface it.
If the prose reads like a generic "the user did N events of category X" template instead of natural language, that is the AI safety-check fallback - the AI's first attempt was rejected for inventing a fact and the system fell back to a deterministic template. Treat the metrics below as authoritative; the prose just lacks flavour.
Verdicts can outlive their evidence. A verdict is kept for about 30 days, but the raw events behind it are on disk for about 7. On an older alert you may see a recorded verdict whose underlying events have aged out - the drawer says so explicitly rather than showing a misleading reconstruction, and every verdict now carries the date it was made. See the investigation digest. To inspect the original events, rehydrate the relevant month.
4. Why this fired (rule engine)
The deterministic rationale the rule itself produced - the receipt under the AI's prose. Compact, factual, no interpretation. Includes the Trigger Why text that any noise gate writes when it demotes an alert - so if you are looking at a low-severity alert, this is where you find out which gate applied and why. If the AI narrative and the rule rationale disagree, trust the rule.
Alert metadata
Category name (e.g. data_exfiltration_high), rule name if it differs from the category, MITRE ATT&CK technique ID + name (e.g. T1567.002 Exfiltration to Cloud Storage), severity badge, detected timestamp.
Key metrics grid
Non-zero numeric tiles drawn from the alert's underlying metrics. Coverage scales to the rule - you see only the fields relevant to what fired. Typical fields include: events, downloads (manual + bytes), uploads, deletes, distinct files, distinct sites, labelled files, sharing operations (with external / anonymous / org-link breakdowns), permission operations, unmanaged events, distinct geos, time span. Every number came straight from Microsoft's audit feed via Burrow's rules engine - no inference, no estimation.
For UEBA alerts (behavioral_deviation, intraday_velocity_burst, peer_group_deviation, etc.) you also see the spiked-metric tile line: which metric drove the alert, today's value, and the typical day it deviated from. The alert's own summary leads with the same shape ("distinct_files spiked: today=576 vs typical day=33 (17x)"). For behavioral_deviation the "typical day" is measured with a robust median rather than an average, so one unusual past day cannot distort the baseline - see the rule catalog.
Operation breakdown
Every UEBA alert shows a compact one-line breakdown of what the user actually did - e.g. FileAccessed: 312, FileModified: 198, FileDownloaded: 4. Instantly answers "was this editing, exfiltration, or browsing?" without drilling into individual events. If the breakdown is mostly passive operations (View, Preview, Access, page render), the alert was likely triggered by content-heavy page browsing rather than deliberate activity.
Context
Geos and top apps for the alert window, if present.
Two geography fields appear here, and they mean different things - do not confuse them:
- Source IP country (registered) - the registered country of each source IP the user actually connected from, e.g.
211.144.19.102 = CN. This is the closest thing to "where was the user". Added 2026-07-05. - SharePoint region (tenant, not user) - the datacenter region hosting your tenant's content, a constant like "NAM" for the whole tenant. This is not where the user is. It was previously mislabelled "Location", which caused a real blind spot - a China-registered session had been rendering as "Location: NAM (North America)". The relabel makes it unmistakable that this field describes your data residency, not the user's whereabouts.
For location-based investigation, read the Source IP country row and the Entra ID sign-in rules (impossible_travel_signin, aad_new_country_signin) - not the SharePoint region.
Download method
Categorical hint about which client(s) produced the download events - for example "OneDrive Sync", "Office Desktop", "Teams", "Browser", "CLI / Script", or the raw client identifier if nothing else matches. Helps distinguish "user mass-downloaded via browser" from "sync client did its job" at a glance - particularly important for data_exfiltration triage.
Top evidence
A sample of up to 8 individual audit events that contributed to the counters. Each row: timestamp (UTC), operation (FileDownloaded, FileDeleted, SharingSet, etc.), file or object name, source IP and geography, user-agent, recipient where available. Deduplicated by filename so the same file previewed five times in seven seconds does not fill the sample - you see distinct files (largest downloads first) so the sample gives real signal.
The full event set lives in the activity event store (queryable in Hunt) - this section just shows the sample for inline triage.
Entity link (opens the Profile tab)
The Profile tab of the drawer holds the Identity dossier view for the alert's user - behavioural baseline, top apps / geos, activity by hour, alert summary. Click across to compare today's activity against the user's baseline. The Events tab shows the user's raw audit timeline; the Chat tab is a per-alert free-form Q&A panel (see Per-alert AI chat).
Disposition buttons
Real / Not real / Maybe on the alert row itself. See Dispositions for what each one actually does.
When the deterministic and narrative disagree
If the narrative says "downloaded 1.2 GB" but the KEY METRICS show 800 MB, trust the metrics. The AI safety check should catch this kind of disagreement before you see it, but if a discrepancy slips through, the deterministic side is always the source of truth.
Raise a support ticket if you see a narrative that mismatches its evidence - that's a safety-check miss the engineering team wants to know about.
See also
- The investigation digest - the top-of-drawer plain-English reconstruction.
- Noise gates - the deterministic filters whose reasoning appears in Trigger Why.
- How an alert flows through Burrow - the full pipeline.
- Investigating an alert - the workflow that uses this anatomy.
- Rule catalog - the deterministic check behind each alert's evidence.
Need help? support@smikar.com.