
Using the Identity Dossier
5 min read · Last updated · Page version 19
The Identity dossier is Burrow's per-user reference card - typical behaviour, today's behaviour, recent alerts, and a persistent AI conversation about the user. It's where you go when an alert is ambiguous and you need to know what's normal for this person.
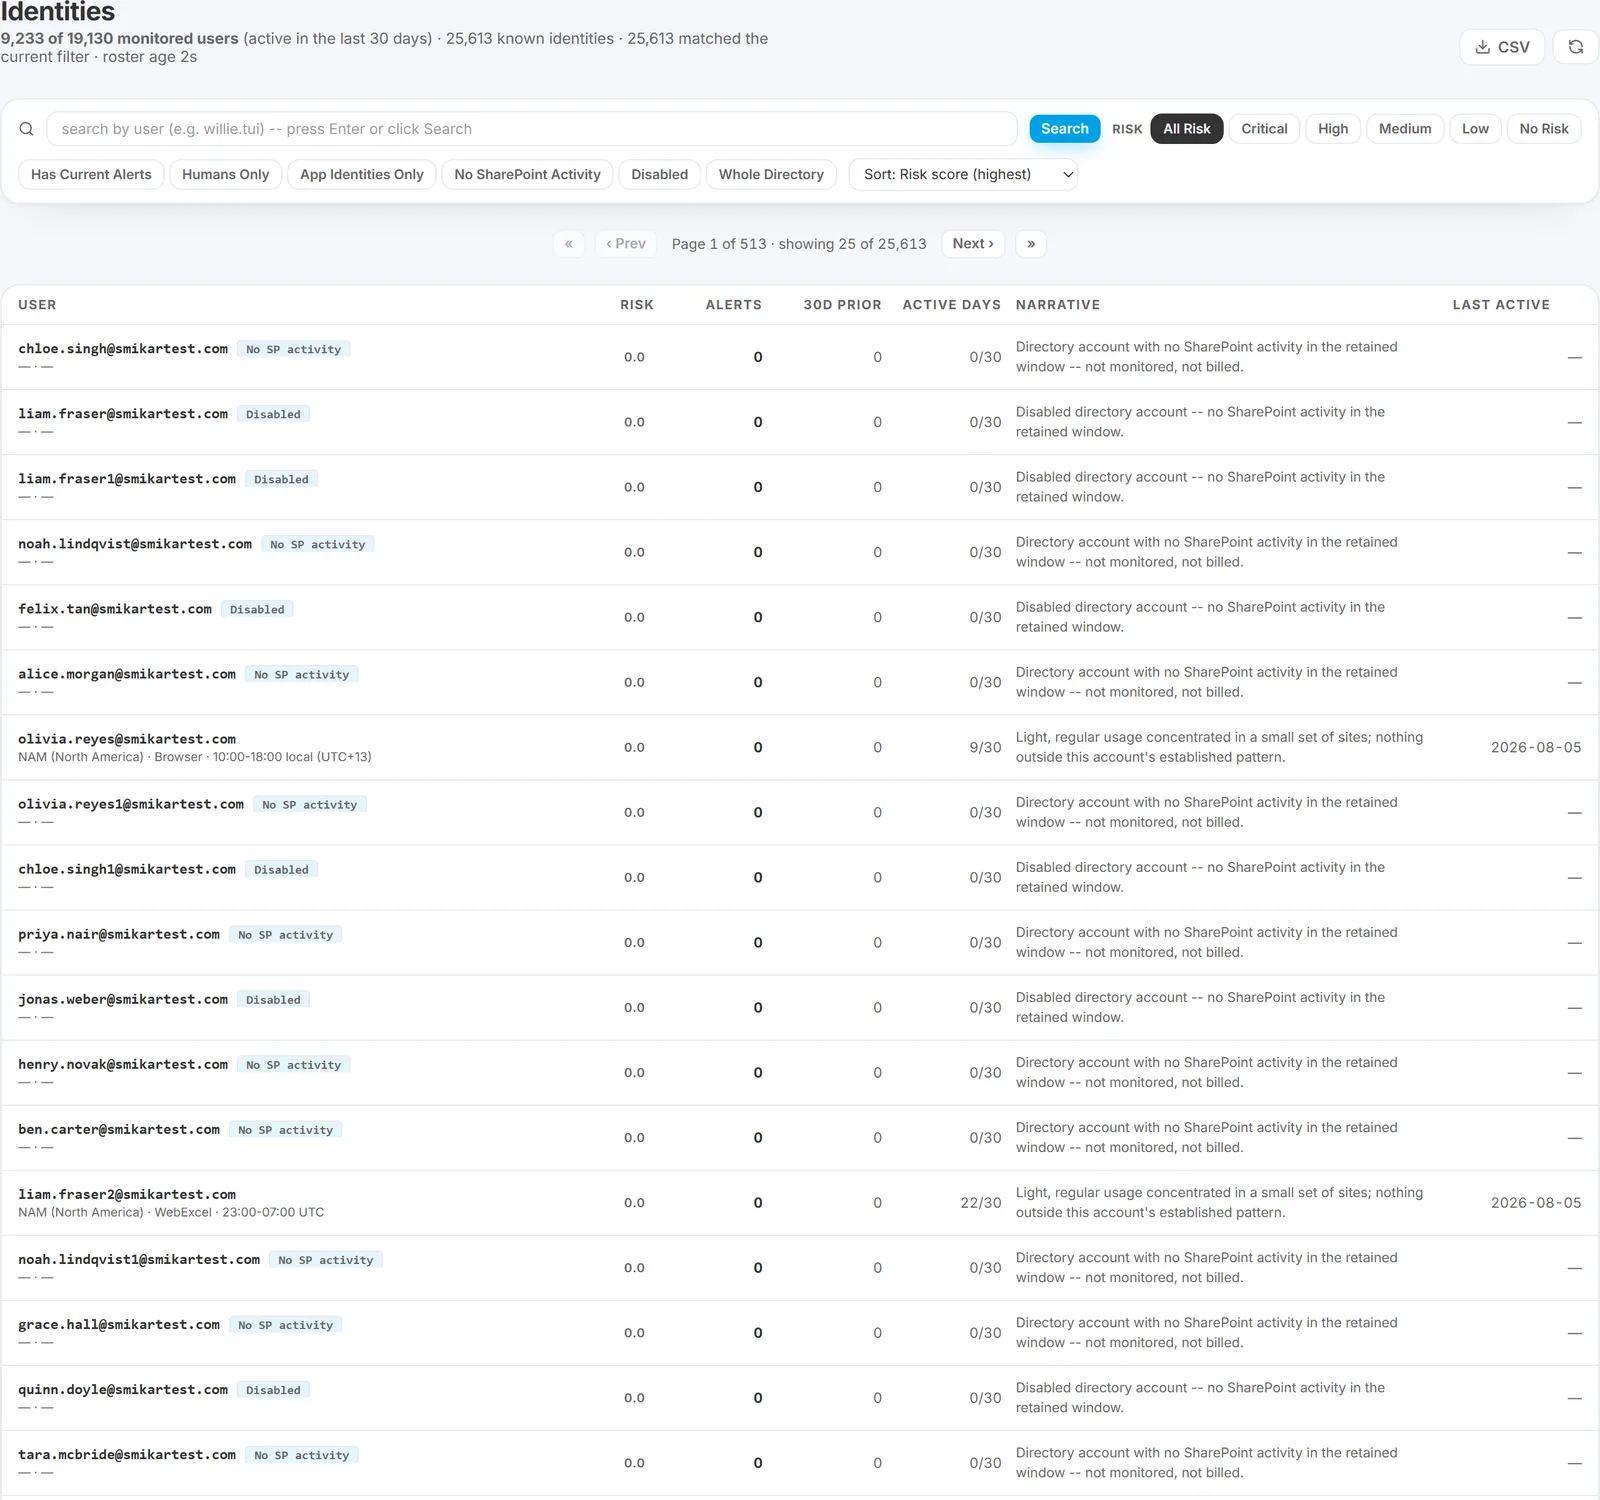
The header states how many people Burrow is monitoring against your directory's enabled-account count. By default the list is the monitored roster; the No SharePoint activity, Disabled and Whole directory chips widen it to the rest of the directory, with a status badge on each row. A disabled account showing recent SharePoint activity is the one to look at first - see disabled_account_activity.
Opening the dossier
Two ways to get there:
- From Identities - click any row. Opens the full-page dossier.
- From Alerts, Hunt, or the home page - click an entity wherever it appears. Opens a narrower right-side drawer with the same content; the drawer has an Open in dossier button to promote it to the full page.
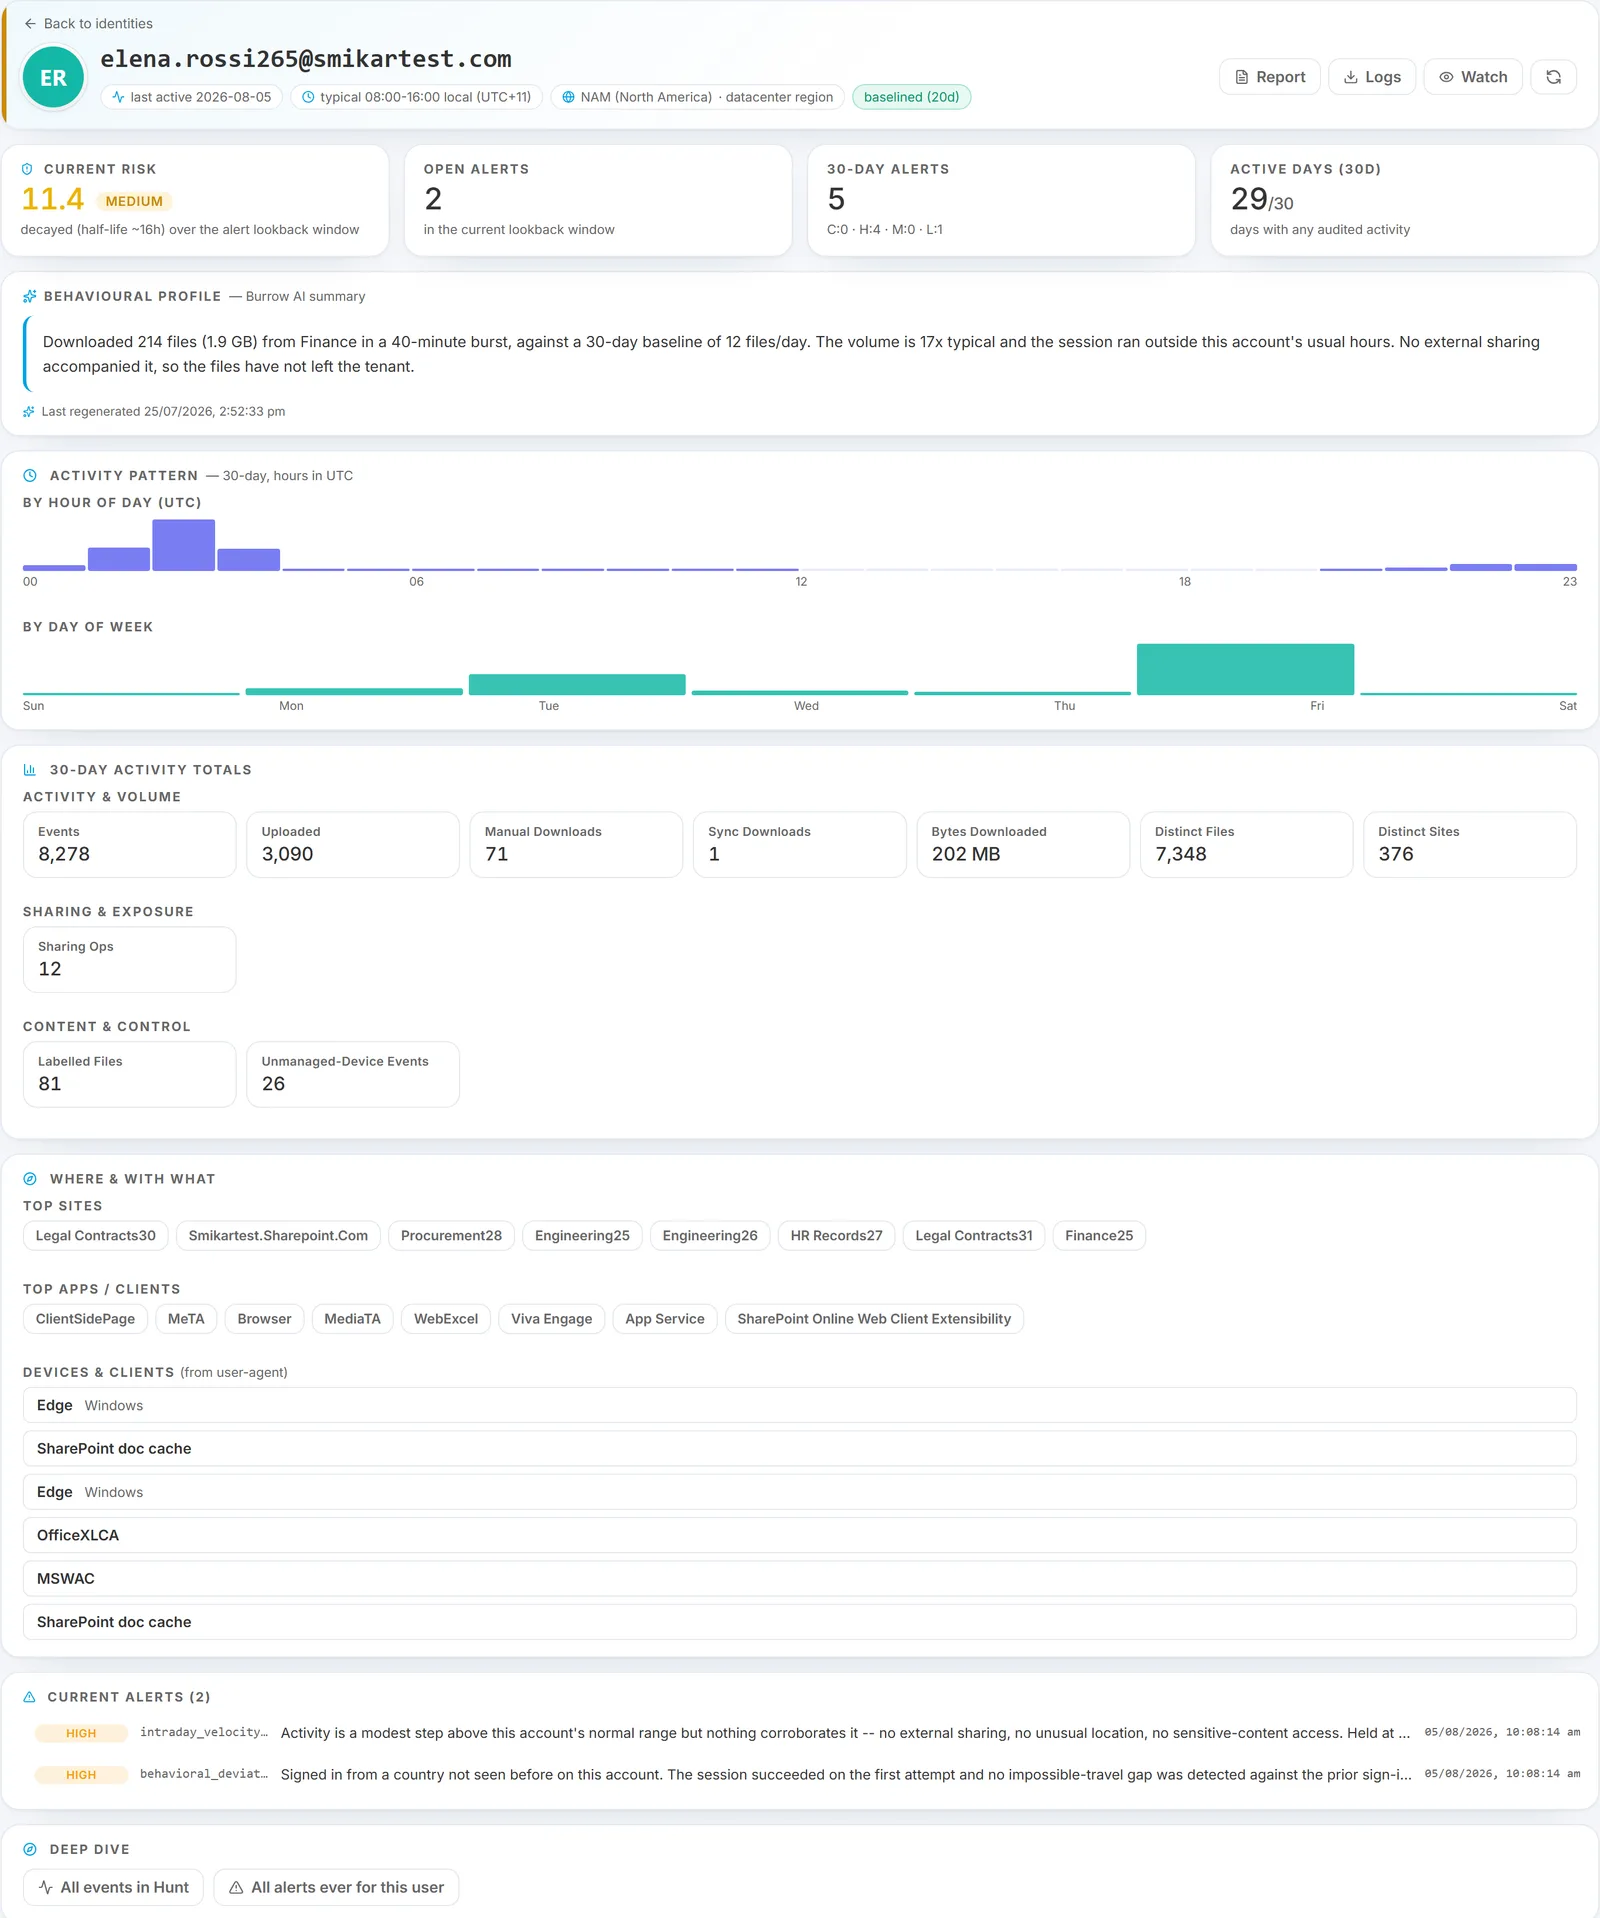
Header actions: Watch, Report, Logs
The identity page header carries three actions beyond the tabs:
- Watch - put this user under heightened monitoring (a departing employee, a flagged account). Turns into a WATCHED badge once active.
- Report - open a polished, AI-written activity report for handing to HR, legal, or an auditor.
- Logs - download the account's raw audit log as CSV or JSONL for evidence.
See Identity report and log export and Watchlist for detail on each.
The Profile tab (default)
The Profile tab answers "what's normal for this user?".
AI summary card
A 2–4 sentence qualitative narrative at the top of the page, written by the behavioural profile builder and refreshed periodically (the card shows when it was last generated).
It is numberless by design. The narrative describes who the entity is - their routine, region, the tools they use, and a qualitative note on their alert pattern - but carries no counts. Every number lives in the live stats panel and histogram right below it.
Reads like: "Jordan Hale is a consistently active North America–based user with a modest, steady download pattern and no external sharing. Works primarily through the browser, Microsoft Teams, Excel, and OneDrive Sync. Recently has had a raised alert count, mostly unusual-hour activity."
The reason for dropping the numbers: the narrative only regenerates periodically, but the stats beside it are live. When the prose baked in a figure - "31 deletes" - it could drift badly from the live total (say, 14,858) on a churny account by the time you read it. Keeping the narrative qualitative and the panel quantitative means the two can never contradict each other. If you want a figure, read the stat cards; if you want the character of the account, read the narrative.
If a behavioural anomaly is present, the summary calls it out - again qualitatively ("a recent spike in downloads unlike their norm"), with the actual magnitude in the baseline line below.
Stat cards
Four numbers at a glance, each over the last 30 days:
- Events - total audit events.
- Downloads - count + total bytes.
- Sharing ops - total + external + anonymous breakdowns.
- Typical UTC - the user's busiest 8-hour window in UTC.
Activity by hour
A histogram of the user's activity per hour of day, over the last 30 days. Use this to spot users with non-standard rhythms - shift workers, on-call rotations, cross-timezone collaborators.
Behavioural baseline
A single line: mean ± standard deviation of events per day across the baseline period, today's count, today's z-score, and today's status (normal / high / low / outlier). This is the line that flips the user into the deviation-rule trigger zone.
Top apps, top geographies, top user agents
Three lists. Useful for "is this IP in their usual geography?" and "is this user agent something they've used before?" questions during alert triage.
Alert summary
A small table of the user's recent alerts grouped by category and severity. Click any row to jump to the alert.
The Events tab
The user's raw audit timeline, scoped to this user. Same data Hunt queries but pre-filtered. Useful when you want to scroll through the user's day without leaving the dossier.
The Chat tab
A persistent AI Q&A scoped to this entity. Ask things like:
- "Did this user share anything externally in the last 30 days?"
- "What's their highest download day in the last quarter?"
- "How does today compare to last Tuesday?"
The AI answers using the user's profile and recent events as context. Every question and answer is saved to this user's dossier so the next SOC shift opening the same identity sees prior conversations without having to redo them.
When to use the dossier
- During alert triage - the dossier in drawer form opens beside the alert; compare today vs baseline in one screen.
- HR / legal pre-questions - when an auditor asks "is anything unusual about this user?", the dossier gives you a defensible one-page summary before you commit to a full Hunt pull.
- Periodic at-risk review - sort the Identities page by risk score, open the top few dossiers, decide whether each is real risk or noise.
See also
- Investigating an alert - the workflow that uses the dossier as one step.
- Hunt 101 - for raw event search across multiple users.
- Per-alert AI chat - different chat surface, scoped to an alert instead of an entity.
Need help? support@smikar.com.