
Investigating an Alert
6 min read · Last updated · Page version 12
The canonical workflow for triaging one alert from the SOC analyst's perspective. Follow this rhythm and most alerts close in under five minutes.
1. Filter the noise out
Open the Alerts page on the Burrow dashboard. The default Active tab is now an honest "needs my attention" queue - alerts the Triage AI judged not real are auto-filtered out, so you start your shift only with things that have not been resolved by either an operator or by the AI's own verdict. (If you ever need to review what the AI dismissed, switch to the Dismissed tab.)
To spot-audit the AI's dismissals without leaving the Active flow, use the two audit chips at the right end of the severity row: + AI-dismissed (silent) for ones the AI dismissed before any email was sent, and + AI-dismissed (emailed) for ones dismissed after the email was sent. Each is a per-session toggle. See Auditing the AI's dismissed alerts for when and how often to use each.
Apply two filter chips at the top:
- Severity - Critical + High to start your shift; expand to Medium once Critical and High are clear.
- Has disposition - set to No so you only see alerts no one has worked yet.
The default lookback window is 24 hours; widen it if you're catching up after time off.
2. Read the alert top to bottom
Click any alert row. The right-side drill drawer opens on the Alert tab (Profile / Events / Chat are the later tabs - for entity context after the alert itself is understood). Read the Alert tab in this order:
- What happened (from the metrics) - a one-line deterministic headline built by code from the alert's key metrics. Not AI.
- What actually happened · reconstructed from raw events - the investigation digest, a plain-English reconstruction of the session, also built entirely by code. Between these two cards you can usually answer "who did what, when" before reading any AI prose at all.
- AI verdict card - the AI's coloured badge (NO / YES / MAYBE) plus 2–3 sentences of "why this matters" prose. Numbers in the prose are safety-checked against the evidence. If it reads like a generic template, the AI safety check rejected the first attempt and you are seeing the deterministic fallback - the facts are still correct, just less flavourful.
- Why this fired (rule engine) - the rule's own deterministic rationale. The receipt under the AI's prose.
- Key metrics grid - the numeric tiles. Counts, bytes, distinct files / sites, geos, whichever the rule emitted. Every number came from Microsoft's audit feed via Burrow's rules engine.
- Operation breakdown (on UEBA alerts) - the one-line summary of what the user actually did:
FileModified: 198, FileDownloaded: 4, etc. Tells you at a glance whether this was editing, exfiltration, or content-heavy browsing. - Download method - the client(s) that produced the download events (OneDrive Sync / Office Desktop / Browser / etc.). Distinguishes "user mass-downloaded via browser" from "sync client did its job".
- Top evidence - a sample of up to 8 distinct audit events (deduplicated by filename). Timestamp, operation, file, site, IP, geo, user-agent.
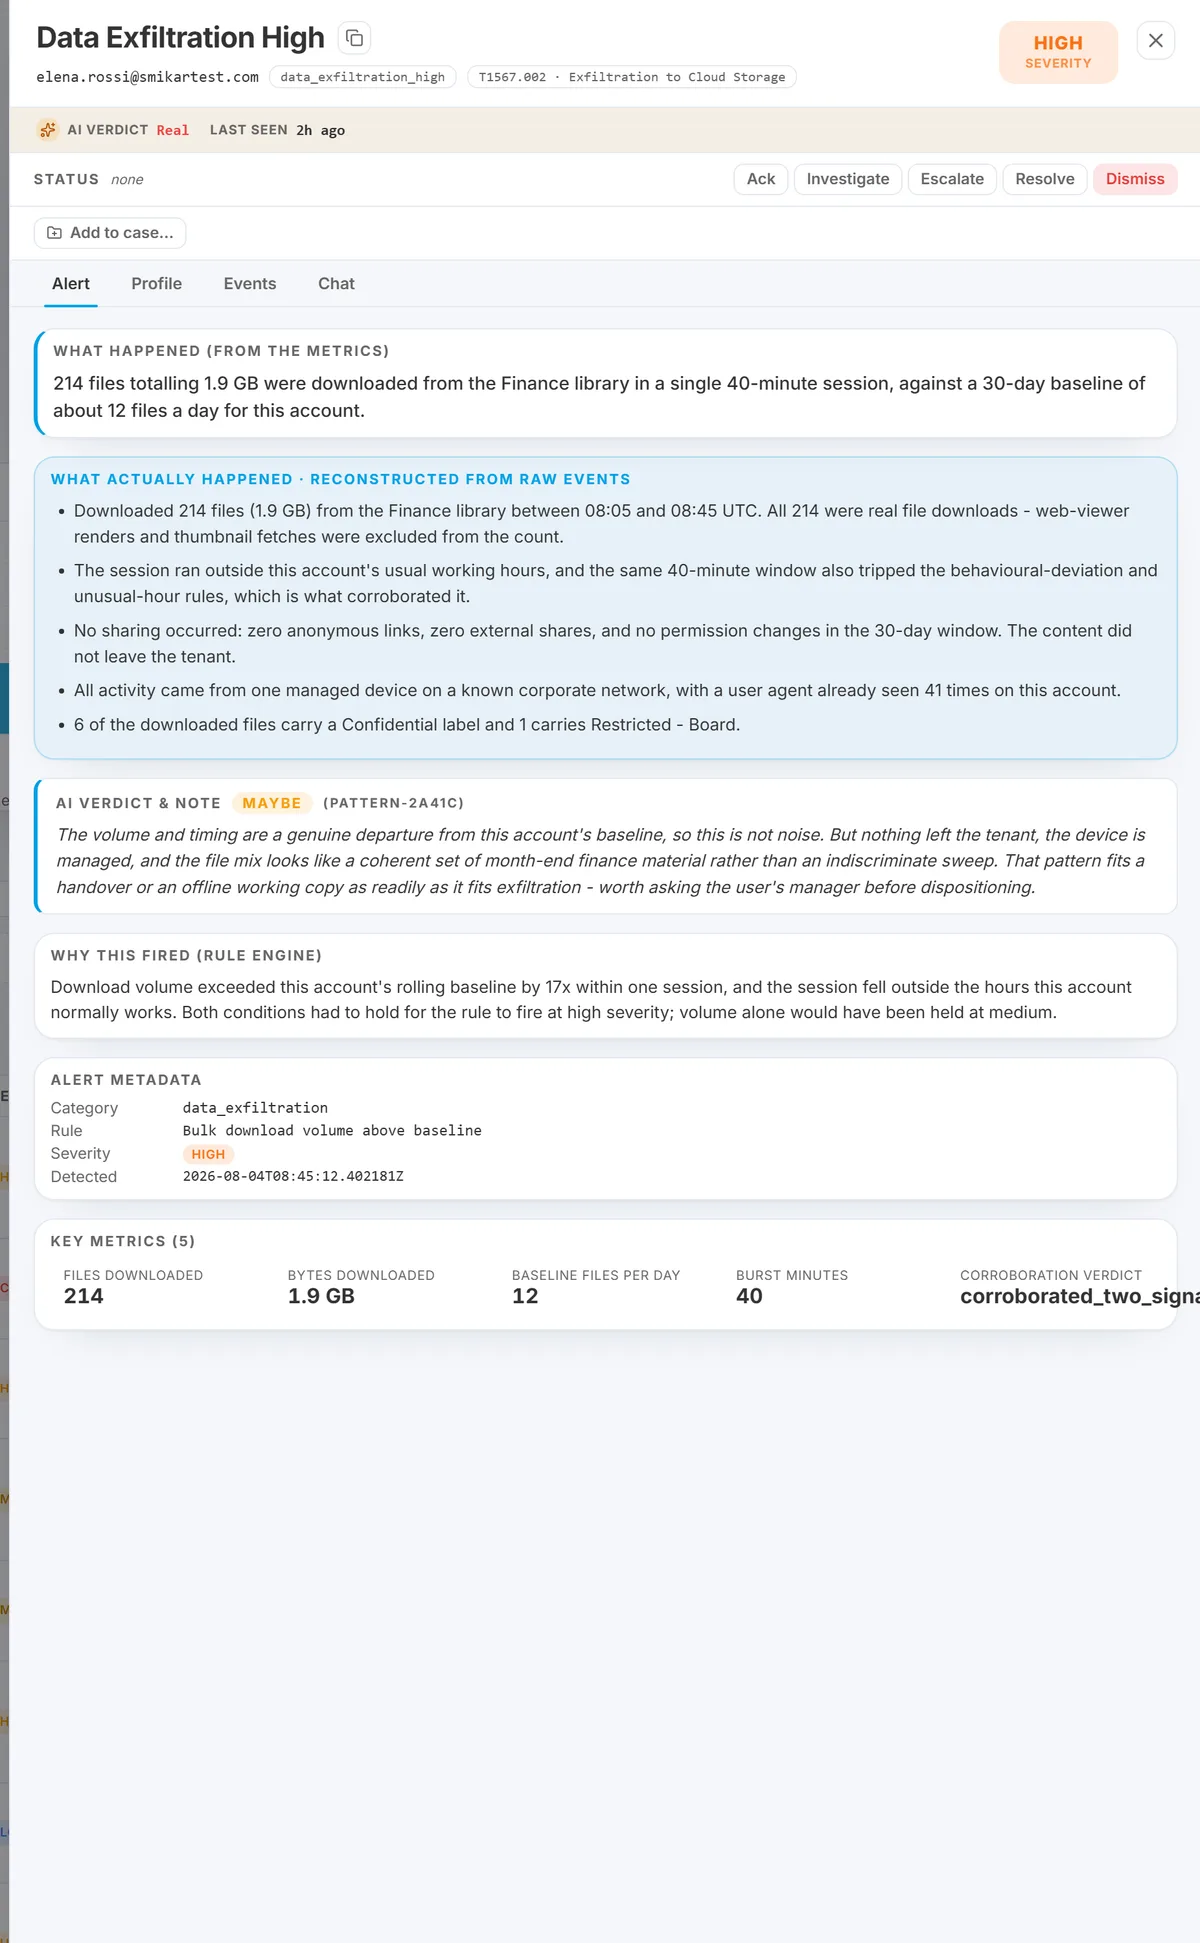
For most alerts these together are enough to make a call. See Reading the evidence box for the full anatomy.
3. Compare against the user's baseline
Switch to the Profile tab in the drawer (or click the user's name to open the full Identity dossier in its own page). The Profile view shows:
- The AI summary card at the top - 2–4 sentence description of the user's typical behaviour.
- The behavioural baseline line - today's event count, the user's mean and standard deviation, today's z-score, today's status (normal / high / low / outlier).
- Top apps, top geographies, typical hours.
The question to answer: is this alert new behaviour for this user, or does it fit their pattern?
4. (Optional) ask the per-alert Chat
Inside the drill drawer is a Chat tab. Type a free-form question like "Did Jordan do anything like this in the last 30 days?" The AI answers with the user's profile plus recent events as context. Every Q&A is persisted to that alert, so the next SOC shift sees prior conversations and doesn't repeat investigations.
5. (Optional) widen the context with Hunt
If you need more than the dossier shows, open Hunt and search the user for the last 24 hours. Filter by op class (Download, Delete, Share, Permission, Label, Access) to narrow.
6. Decide
In the drawer, click one of:
- Real - escalates, keeps the alert visible, feeds the daily pattern detector.
- Not real - closes the alert, suppresses future emails for the same (user, category) pair, and feeds the tuning advisor (which may later suggest raising the threshold for that rule on that user).
- Maybe - keeps the alert open for the next shift.
The disposition is recorded against the (user, category) pair, logged on the History page with your analyst identity, and visible to the next shift.
7. (When appropriate) add an entity exception
If you can see on first read that the same (user, category) pair is permanent noise - a service account, a known scheduled job, a vendor automation - you have two fast paths straight from the Alerts page row without opening the Exceptions form:
- Suppress pair icon (shield-with-slash) - creates a suppress exception for this user + category. Future alerts of the pair stop firing.
- Downgrade pair icon (down-arrow-circle) - creates a downgrade exception. Future alerts of the pair drop one severity tier before the email gate decides.
Either click stamps your operator identity on the exception and writes a row to the History page. These are distinct from Dismiss, which only acts on the single alert in front of you. See Suppress and Downgrade pair actions for the full behaviour, the Downgrade caveat, and how to reverse.
For more complex patterns (wildcards across multiple users, a whole tenant of bots, an app@sharepoint* style match), open the Exceptions page and Add Exception manually. See Entity exceptions for the full pattern syntax.
See also
- The Alerts page - the queue this workflow starts from.
- Reading the evidence box - anatomy of an alert's evidence panel.
- Using the Identity dossier - every tab and what it tells you.
- Dispositions - what your "not real" click actually does downstream.
Need help? support@smikar.com.