
The Alerts Page
7 min read · Last updated · Page version 7
The Alerts page is where an analyst spends most of their day: the queue of everything Burrow has detected, with the controls to narrow it to what actually needs a person. This article covers the page itself. For the workflow of triaging one alert, see Investigating an alert.
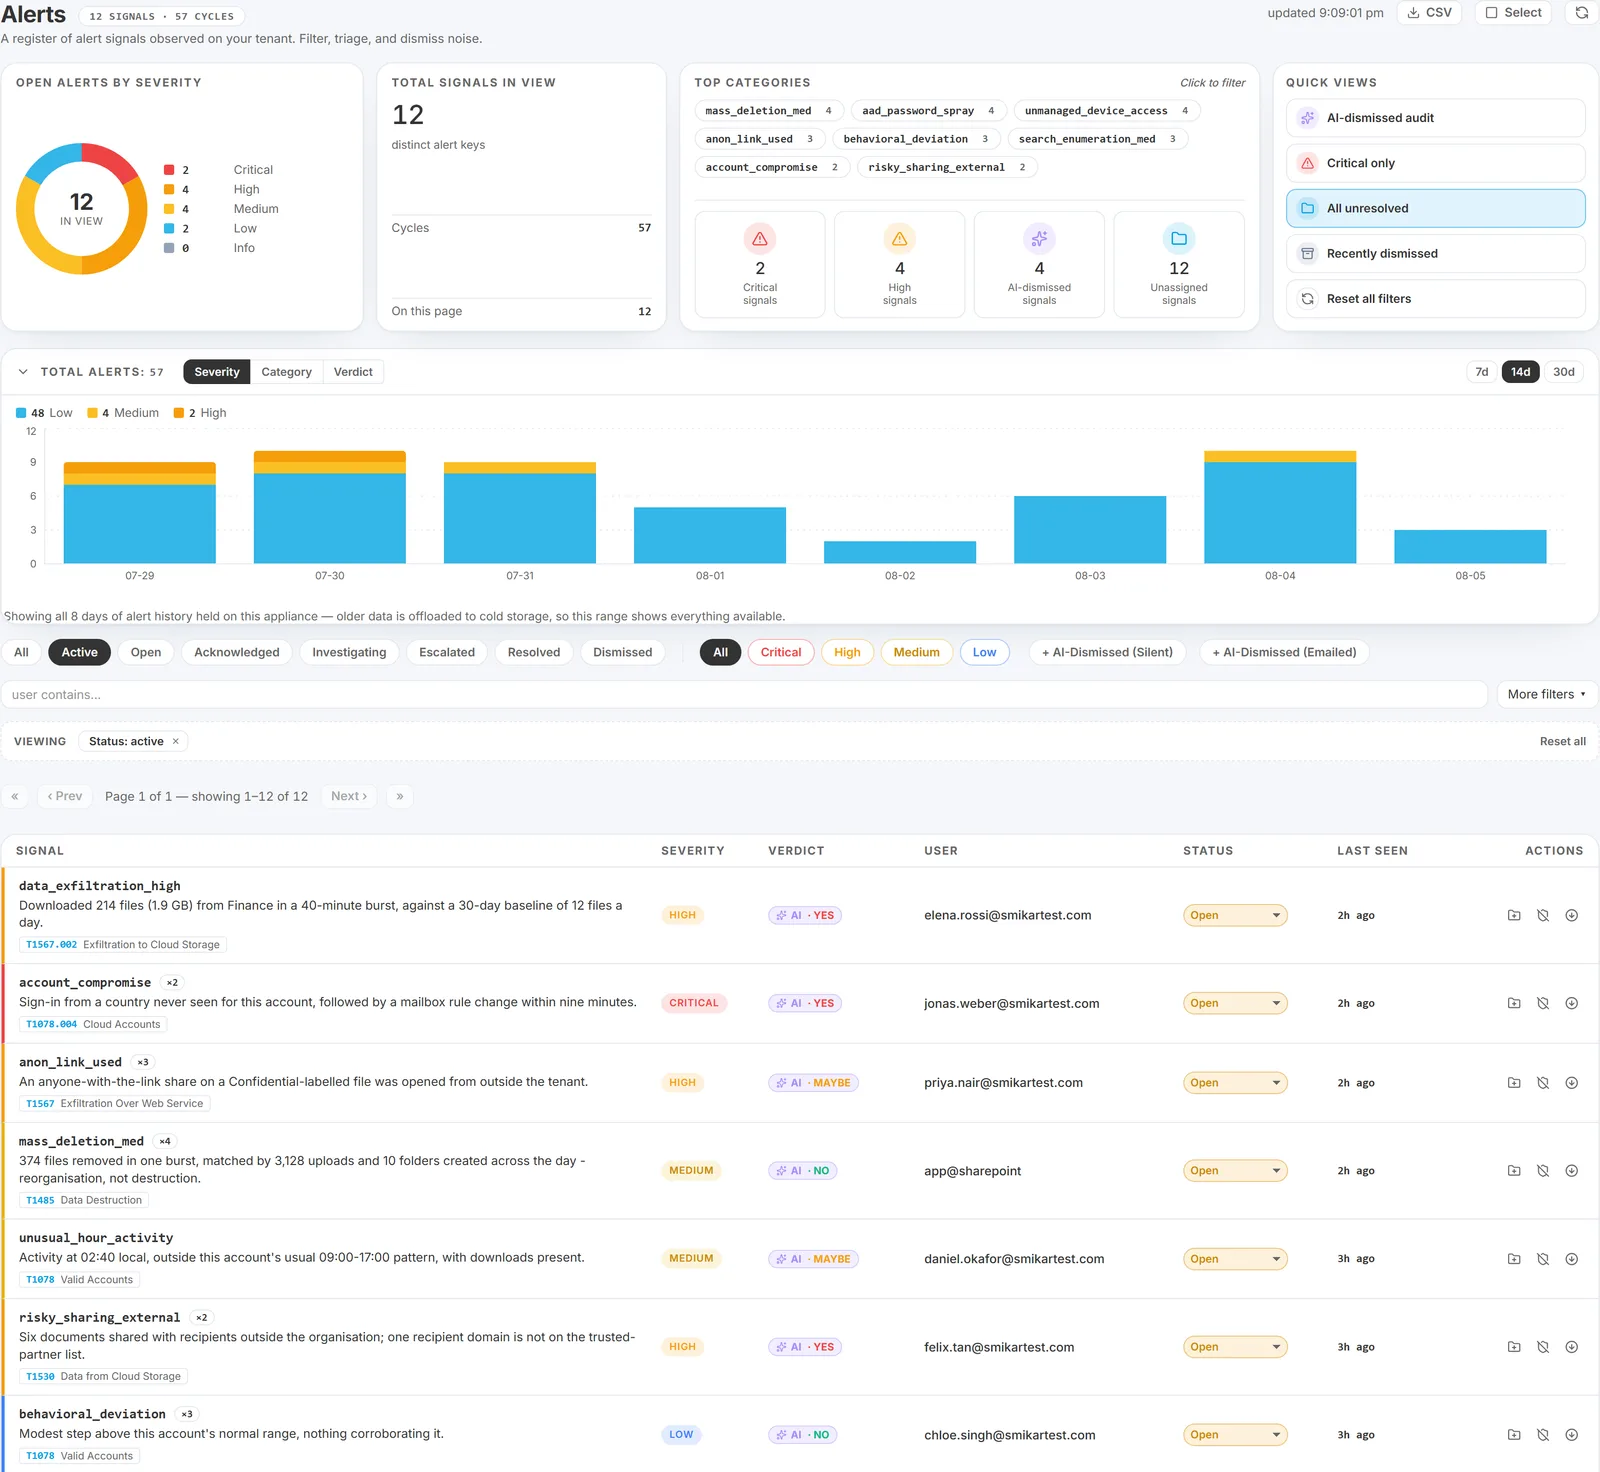
The hero: the shape of the queue before the list
The top of the page is a four-panel hero, designed so you can read the state of the queue before reading any individual alert:
- Severity donut with the in-view total.
- Total signals card with cycle stats.
- Top categories - a clickable tag cloud plus four priority tiles: Critical, High, AI-dismissed, Unassigned.
- Quick Views - one-click filters down the right side: AI-dismissed audit, Critical only, All unresolved, Recently dismissed, and Reset all filters.
The tile counts capture the baseline queue and stay stable when you click a tile to drill in, so the number you clicked is still the number you see - no "did that just change?" second-guessing.
Below the hero sits the severity-stacked trend chart, then the filters.
Status tabs - what "Active" actually means
All / Active / Open / Acknowledged / Investigating / Escalated / Resolved / Dismissed.
The default is Active, and it means needs my attention right now. Active excludes two things: alerts you have explicitly Resolved or Dismissed, and alerts the Triage AI judged not real. The exception is operator override - if you have set Acknowledged, Investigating or Escalated on an alert, it stays visible regardless of what the AI thinks. Operator override always wins.
Reopening a dismissed alert. Reopened is one of the values in the inline status select on each row - it is not a filter tab. Setting it, or clicking Reopen on the alert's History row, returns the alert to Active and Open even if the AI judged it not real, because reopening is an operator override and the operator always wins.
AI-dismissed alerts are not lost. They sit under the Dismissed tab alongside the ones you dismissed yourself. You can tell them apart on the row:
- AI-dismissed - empty status select, plus the AI · NO verdict badge.
- Operator-dismissed - "Dismissed" shown in the status select.
Filters
Severity chips, plus two audit chips that deliberately bypass the AI auto-filter for spot-checking: + AI-dismissed (silent) for alerts the AI dismissed before any email went out, and + AI-dismissed (emailed) for ones it marked not-real after you had already been emailed. Both off by default. See Auditing the AI's dismissed alerts for how often to use them.
Active filter strip. A dashed strip above the pager lists every filter currently applied - Status: Active ×, Category: data_exfiltration × - each with an inline × to clear just that one, plus a Reset all link. Worth knowing about when you are scrolled deep into a list and cannot remember what you narrowed by.
Date range (From / To). Inclusive of both ends, and the pickers only offer days actually held on the appliance, so you cannot select a range that returns nothing. Leaving one side empty gives an open-ended range - "everything since Monday", "everything up to the 25th".
The date range also constrains bulk actions. When a range is set, the bulk Suppress matching and Dismiss ALL actions honour it, and the confirmation dialog says so. This is the safeguard that stops "dismiss all" meaning more than you intended.
Filters live in the page address, so a filtered view can be bookmarked or pasted to a colleague and opens with the same chips applied. It is also how the home page donut slices hand off to a pre-filtered list. A MITRE filter matches sub-techniques, so T1078 includes T1078.004.
The list
Columns: Signal (category, summary, MITRE tag) / Severity / Verdict / User / Status / Last seen / Actions. The severity colour-strip runs down the left edge of each row. On a narrow window the less critical columns (Verdict, User, Last seen) hide rather than overflow.
Pagination is 200 rows per page, labelled Page 6 of 20 - showing 1,001-1,200 of 3,949, with Prev / Next and a Jump to page box. Out-of-range numbers clamp to the first or last page rather than erroring.
Per-row actions on every row:
- Inline status select - set a disposition without opening the alert. Hovering it shows when the current disposition was set and by whom, which is how you tell a month-old dismissal from something that has just come back: the same alert key recurring is a different situation from one you closed this morning.
- Link to case - attach it to an investigation.
- Suppress pair - create an entity exception silencing future alerts for this user and category.
- Downgrade pair - future alerts for this pair drop one severity tier.
See Suppress and Downgrade pair actions for what each writes to the audit trail. Selecting rows brings up a bulk-action bar.
Before a bulk dismissal: the impact preview
Bulk Dismiss does not execute immediately. Burrow first shows what you are about to hide:
- how many alerts, and their severity mix;
- any the AI judged likely real;
- any belonging to a watchlisted user;
- whether repeated dismissals are getting close to auto-quieting that pattern.
The dialog then asks which of two things you mean, and the distinction matters more than it first appears:
- A queue sweep - clearing the list, not judging it. Recorded, reversible, and never feeds the learned quieting.
- Judged benign - you have looked at these and they are fine. This one does train the quieting behaviour.
Before that distinction existed, a routine clean-out looked identical to a considered judgment, so repeated sweeps could quietly teach Burrow to stop alerting on things nobody had actually examined. Only deliberate judgments train it now.
Undoing a bulk action
Every bulk dismissal - multi-select Dismiss, Suppress matching, or Dismiss ALL - is recorded as one batch. An Undo bar appears on this page straight after it runs, and the History page keeps a Recent bulk actions list with one-click Undo for longer.
The drill drawer
Clicking any row opens the right-side drill drawer with four tabs - Alert (default), Profile, Events, Chat.
The header shows the category name, the user, a right-aligned severity block and a copy-key button. Below it an amber insight bar summarises the AI verdict, how many times the alert has fired, whether it emailed, the span it covers and when it was last seen - so the shape of the alert reads without scrolling.
The Alert tab is organised as a trust hierarchy: deterministic headline first, then the investigation digest, then the AI verdict, then the rule-engine rationale, metrics and evidence. You can reach a defensible conclusion from the top two cards without trusting any AI prose. See Reading the evidence box.
Why this page and the home page can show different totals
They answer different questions and both are right. The home page covers the last 24 hours and its raw count includes alerts already dismissed; the Alerts page covers the full retention window and defaults to showing only what is still Active. The Needs attention tile is the figure common to both - treat it as the day's to-do count.
See also
- Investigating an alert - the triage workflow that starts here.
- Reading the evidence box - the anatomy of the drawer.
- Dispositions - what each status means and what it writes.
- Auditing the AI's dismissed alerts - spot-checking what the AI filtered out.
- The Burrow dashboard home page - the overview this page drills down from.
Need help? support@smikar.com.