
Squirrel Analytics - Storage, Activity and Cost Trends
8 min read · Last updated · Page version 7
Alongside the downloadable reports, the Squirrel dashboard carries a set of read-only analytics pages. Where reports answer "give me the numbers as a file", these answer "show me the trend" - which sites are growing, which have gone quiet, and whether archiving has paid for itself yet.
Storage Comparison
Two tabs, both about storage over time.
Storage Comparison plots archived storage under management against SharePoint storage across the billing timeline, one point per monthly invoice, in terabytes, with a dashed crossover point reference line. Stat panels show initial storage, the crossover point, and archived blob storage. The archived blob storage figure is the archive size on your latest invoice: the same figure you are billed for and the dashboard's Total Archived Data, net of files since restored or deleted. The crossover here is the volume crossover - the month where more of your data sits in the archive than in SharePoint. Until it happens, the panel reads "Not reached" rather than estimating a date.
For the same comparison expressed in money rather than terabytes, see Costs below. The two pages are easy to confuse: this one answers "where is my data", Costs answers "what is it costing me".
SharePoint Timeline is a dual-axis chart of total SharePoint used (TB) against site count, over a selectable range from 6 hours to all data, defaulting to 7 days. Stat panels cover current size, total sites, and size change across the period. This is where unexpected tenant growth shows up first.
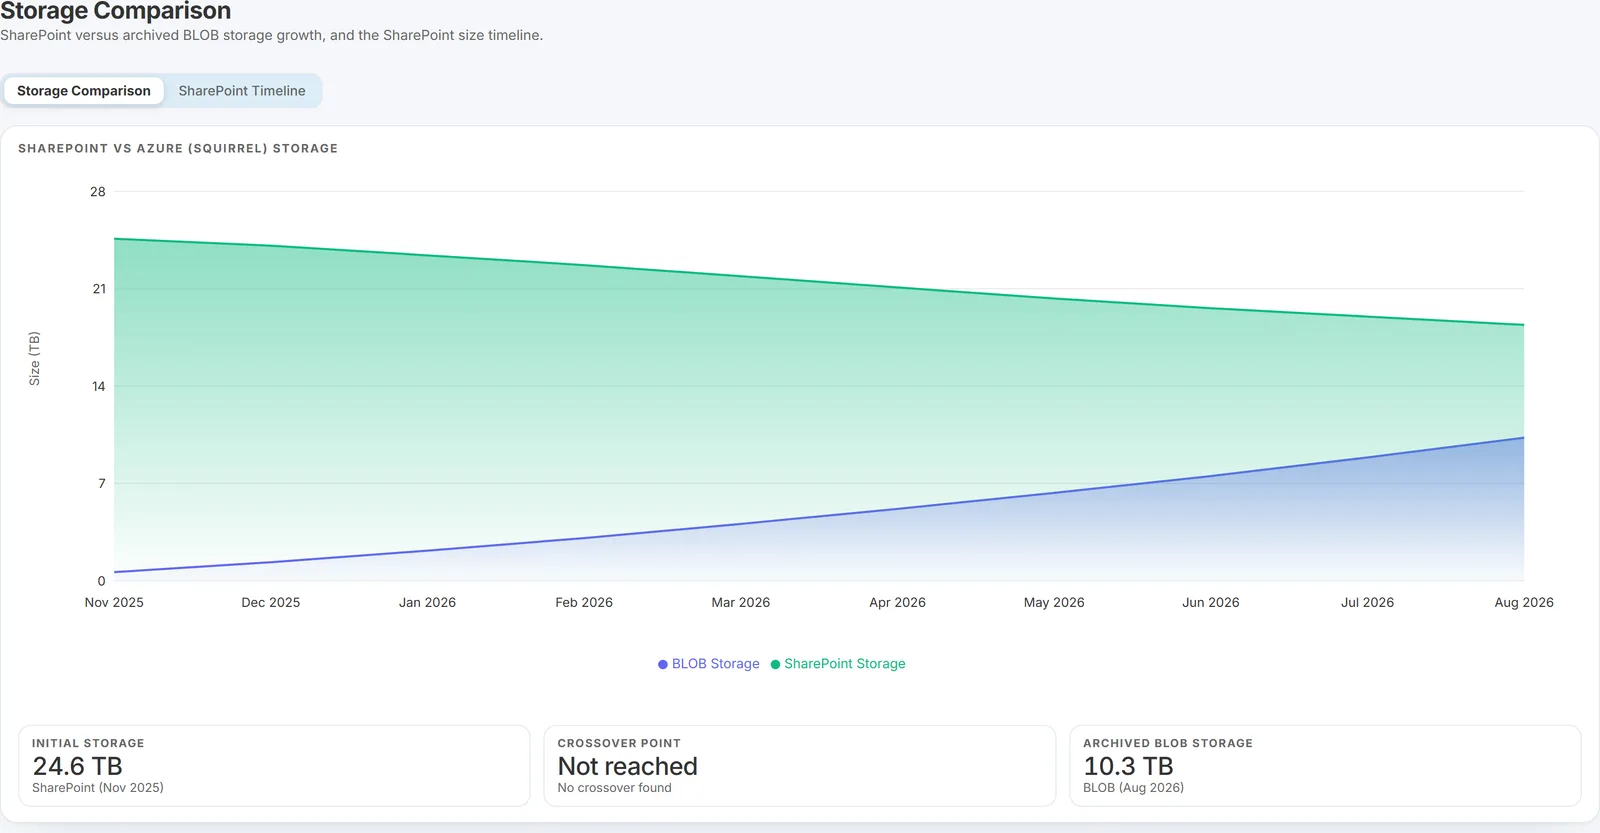
A tenant that has not accumulated any billing history yet sees “No data collected yet” rather than an error - there is nothing wrong, the series simply starts at your first invoice.
Transaction Analysis
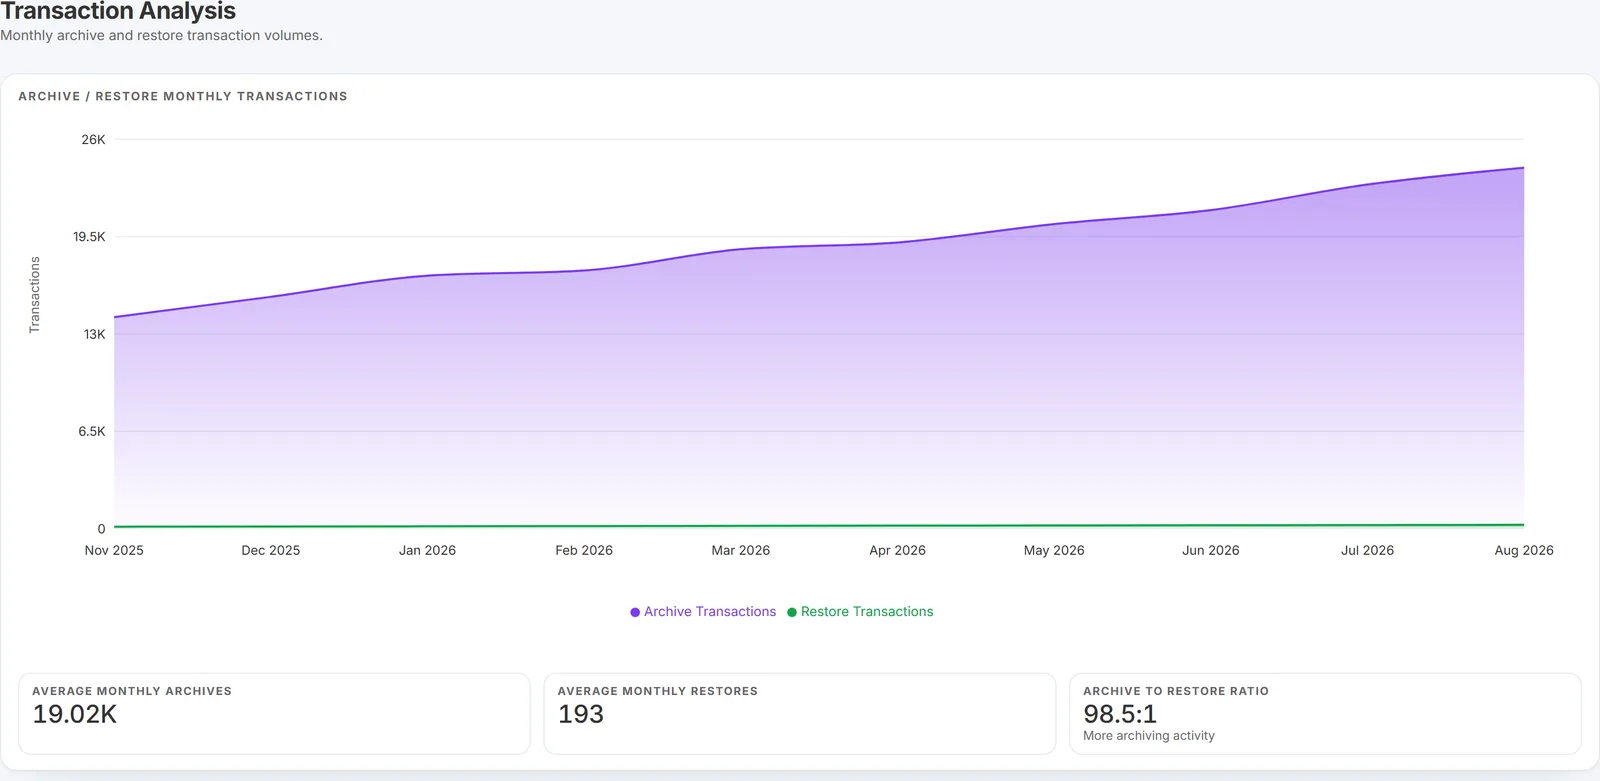
A monthly chart of archive transactions against restore transactions, with stat panels for average monthly archives, average monthly restores, and the archive-to-restore ratio - which carries a plain-English descriptor rather than leaving you to interpret a number, ranging from "Much more archiving than restoring" through to "More restoring than archiving".
That ratio is worth watching. Archiving far more than you restore is the expected healthy pattern. A drift toward restoring suggests your policies are archiving content that is still in use, which is a signal to revisit site policies rather than to stop archiving.
There are no controls on this page.
SharePoint Site Analysis
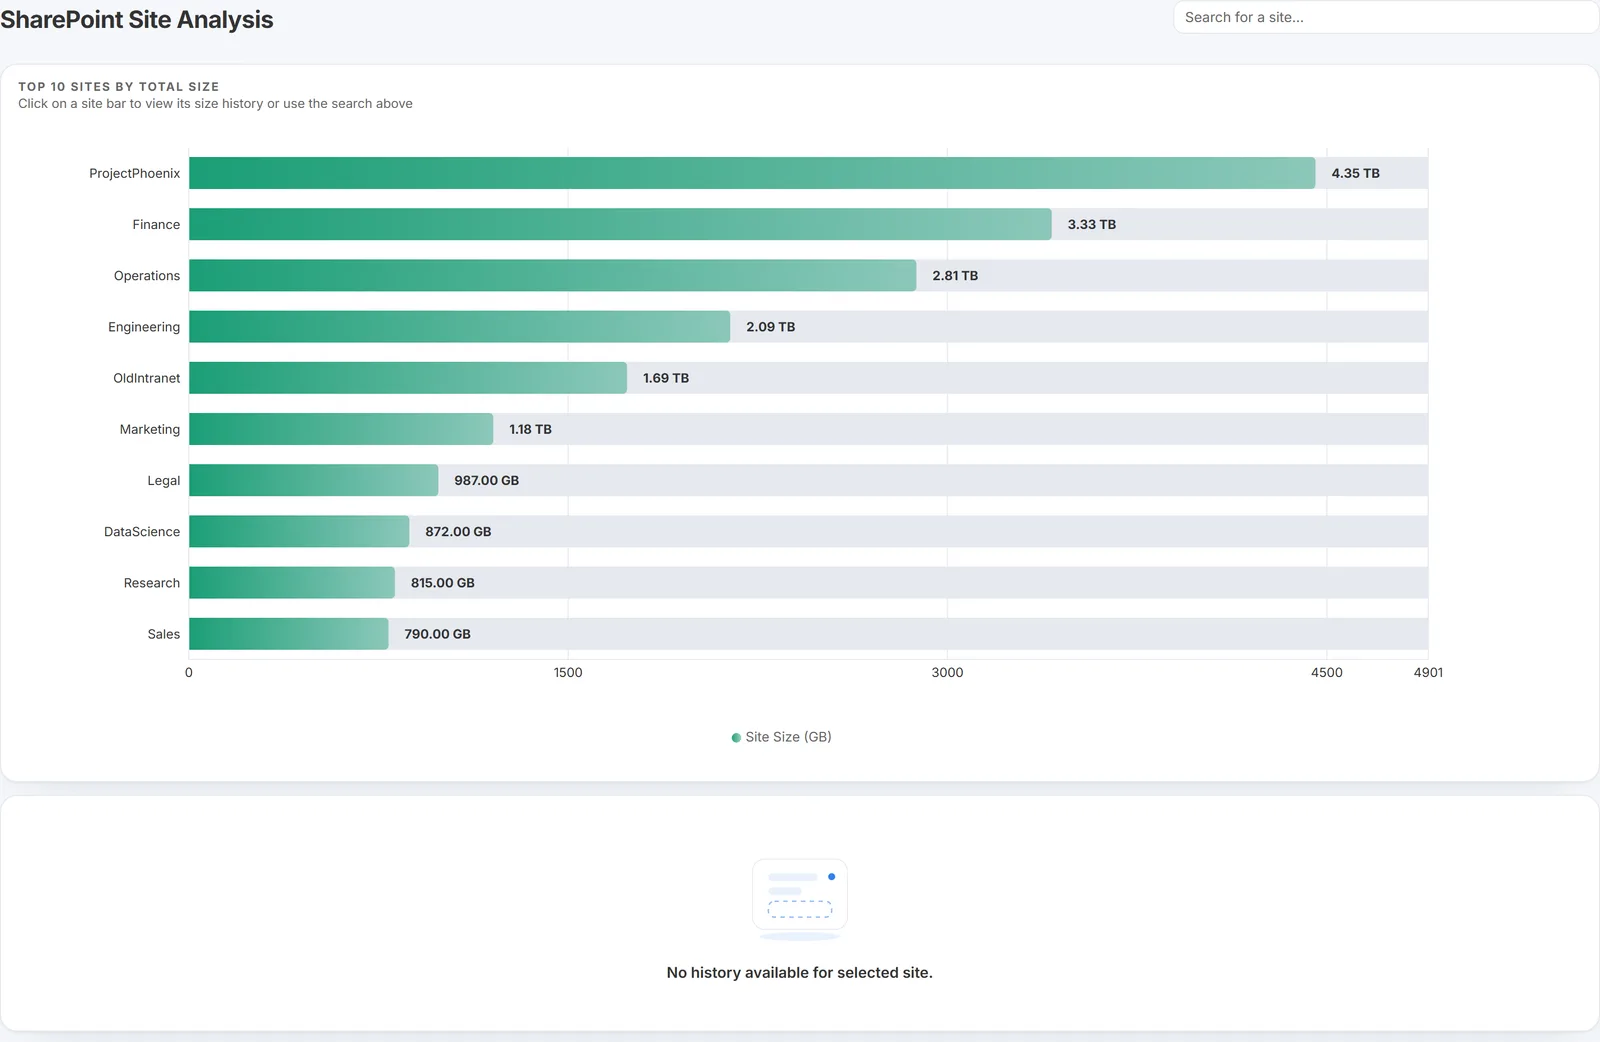
Top 10 Sites by Total Size as a horizontal bar chart, with a site search in the header. Click a site bar - or search for a site - to load Size History for it: a month-by-month area chart with initial size, current size, and growth. Sites that started from near zero show growth as "New" rather than an unhelpful percentage.
Two common uses: finding the biggest sites to onboard into archiving, and showing a site owner their own growth curve when you need them to agree to a policy.
SharePoint Site Activity
The dormant-site finder, ranked by days since last activity. This is how you build a "candidates for aggressive archiving" list with evidence behind it.
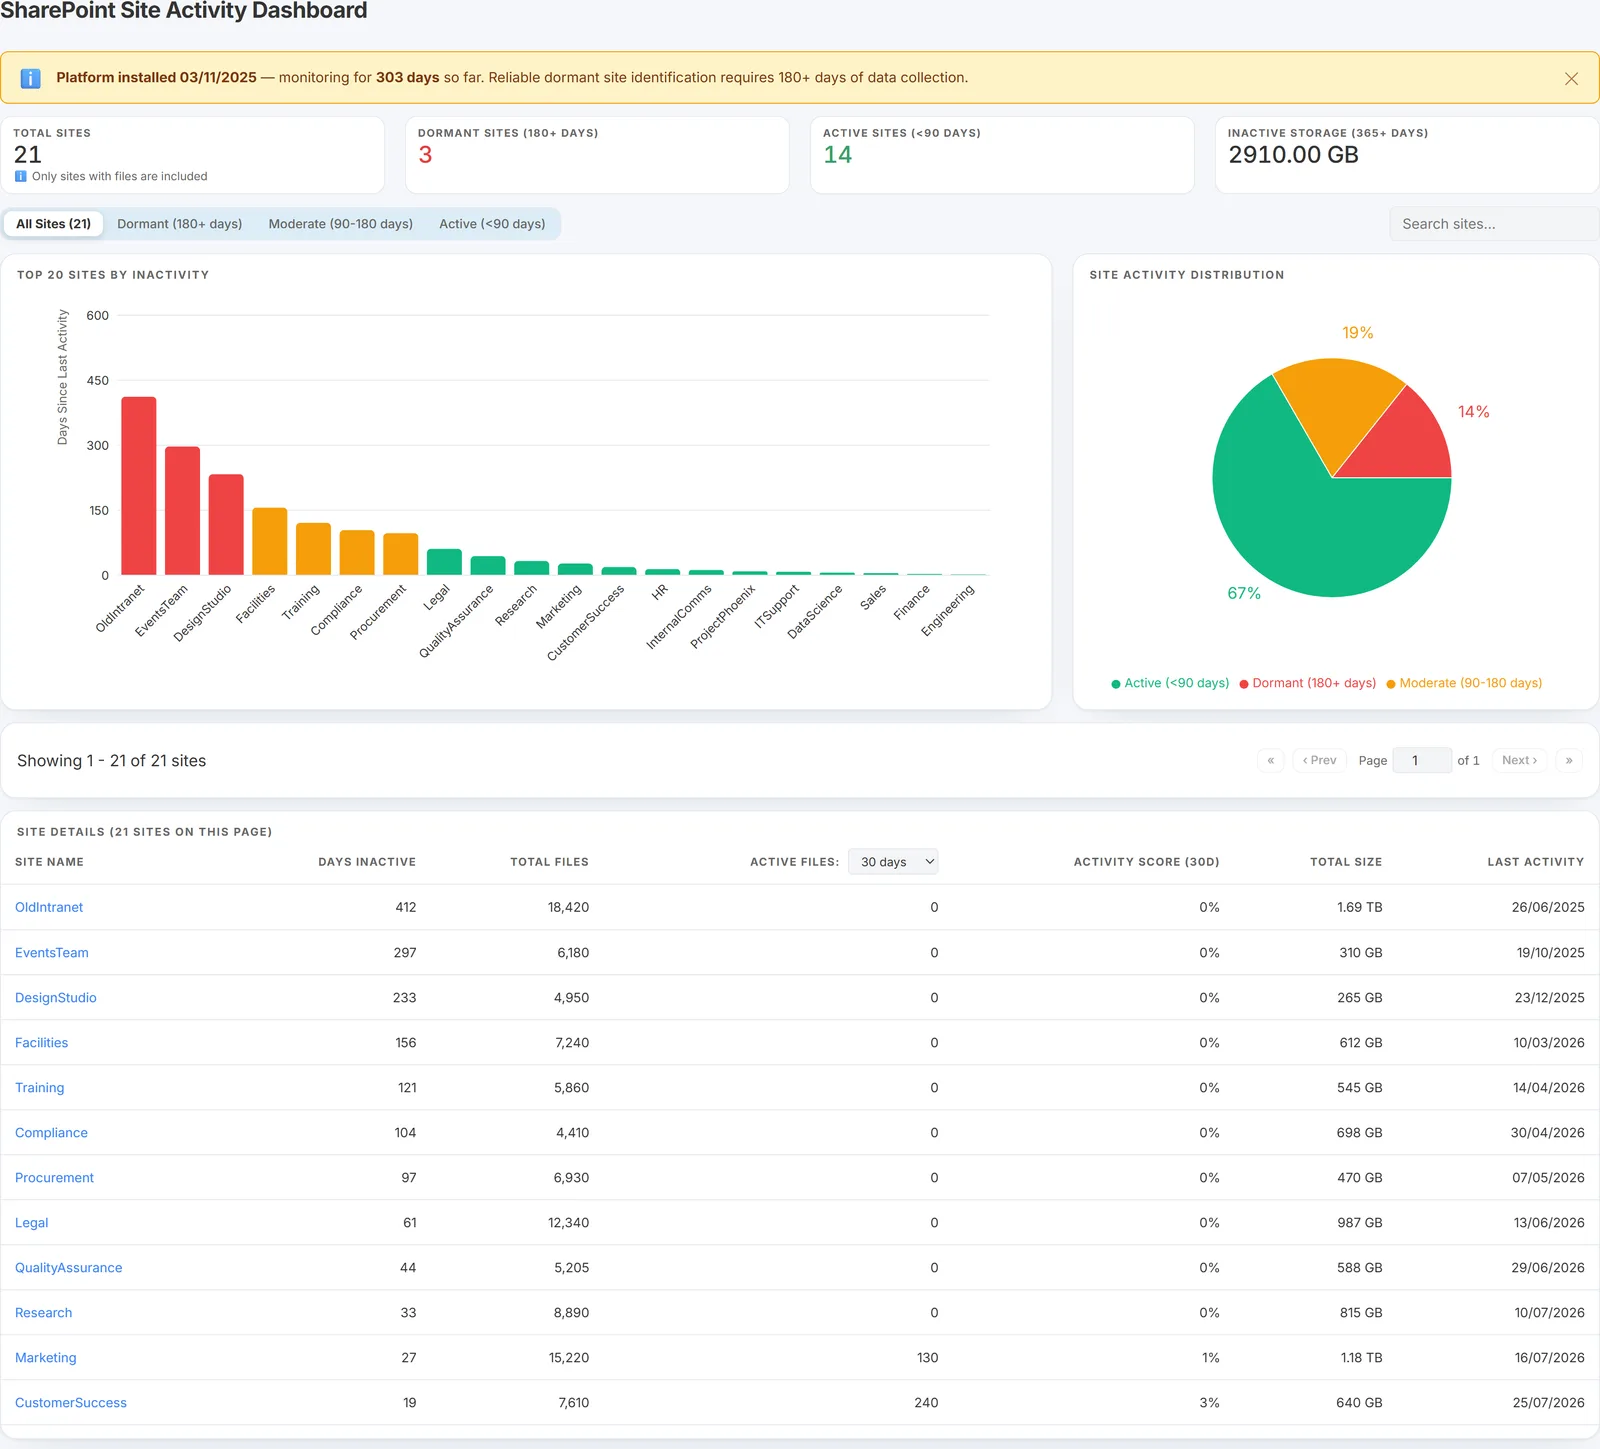
- Data-maturity banner - shows the platform install date and how many days have been monitored, and states plainly that reliable dormant-site identification needs 180+ days of collection. Read this first. A site that looks dormant after three weeks of monitoring may simply not have been observed long enough.
- Stat cards - total sites (counting only sites that have files), dormant sites at 180+ days, active sites under 90 days, and inactive storage at 365+ days in GB.
- Charts - Top 20 Sites by Inactivity as a colour-banded bar chart, plus a dormant / moderate / active pie.
- Table - per site: days inactive, total files, active files with an inline window selector from 7 to 730 days (default 30), an activity score giving the percentage of files touched in that window, total size, last activity ("Never" where there is none), and a link to the site. Filter chips for All / Dormant / Moderate / Active, plus search.
The activity score is the column that settles arguments. "This site has had 2% of its files touched in the last 30 days" is a more durable justification for a policy threshold than "it feels quiet".
File Type Analytics
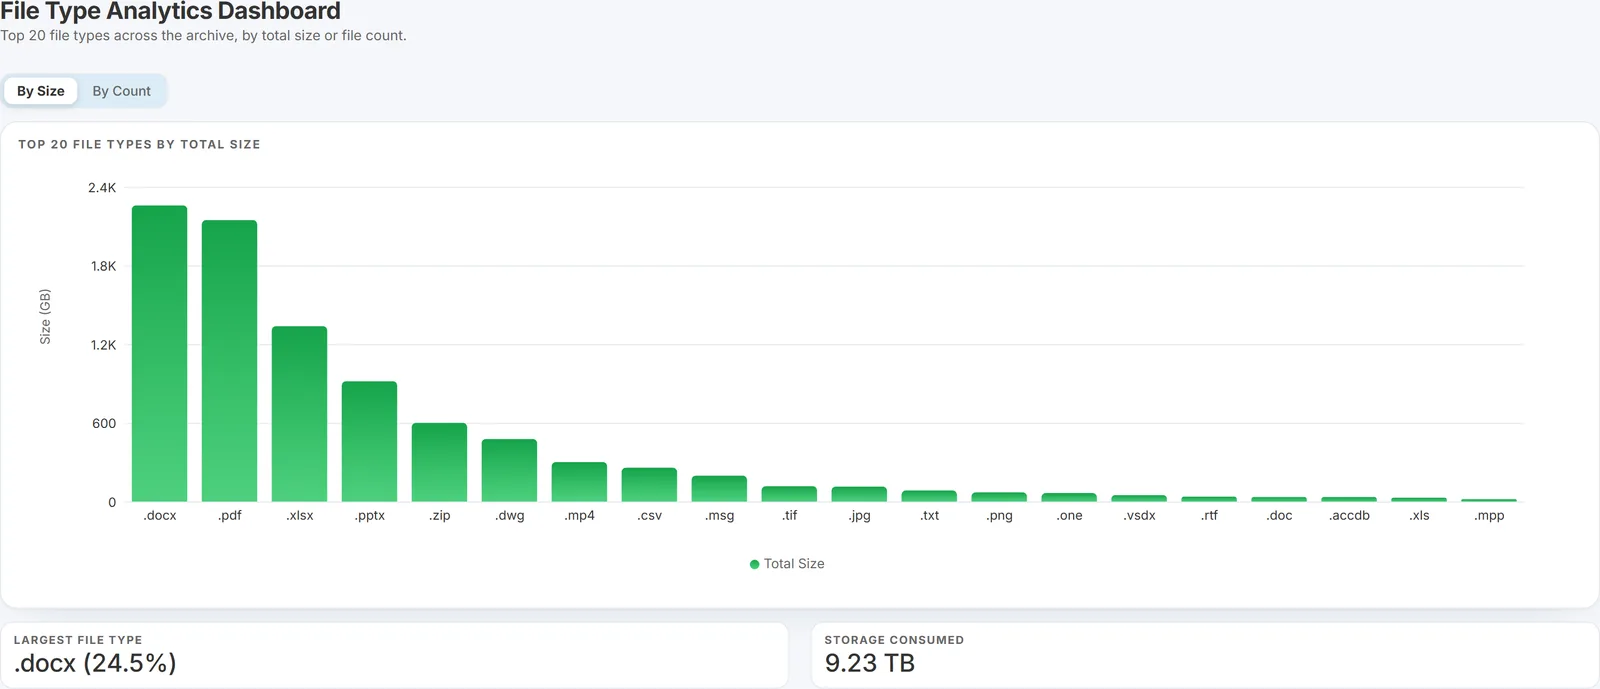
The top 20 archived file extensions as a bar chart, toggleable between By Size and By Count - which are often different stories, since a handful of large media files can outweigh thousands of documents. Stat cards show the largest file type, the most common file type with its percentage share, and total storage consumed.
Costs
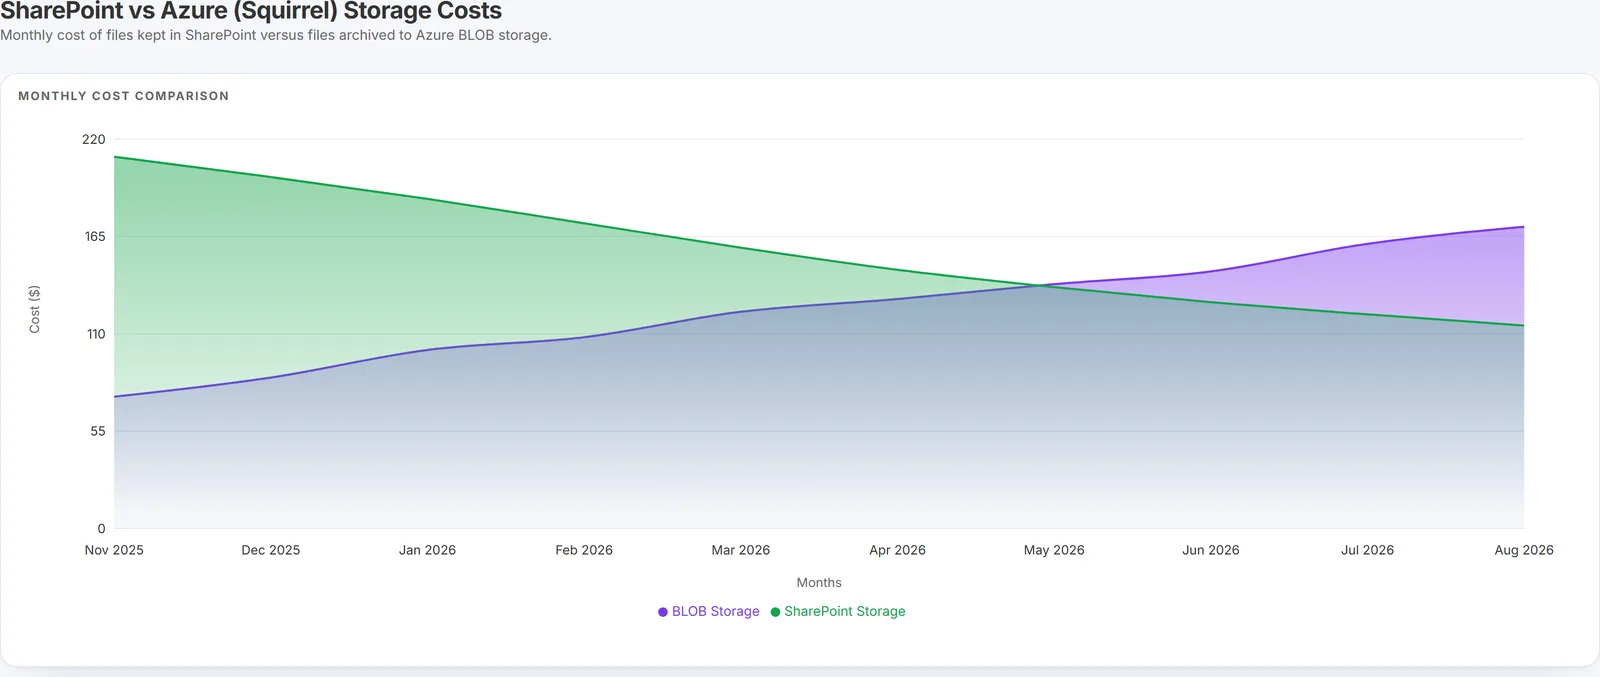
SharePoint vs Azure (Squirrel) Storage Costs - a monthly comparison of what your files cost kept in SharePoint against what they cost archived to Azure blob storage, plotted as two series over the billing timeline.
This is the "is archiving paying for itself" chart. The point where the two lines cross is the month archiving started costing less than leaving the content in SharePoint, and after it the gap between the lines is your ongoing monthly saving. Unlike the Storage Comparison page, which is measured in terabytes, this one is measured in currency and is the one to take to a budget conversation.
The archive overview carries a condensed version of the same idea in its Saved vs SharePoint storage card.
Cost Allocation
Chargeback by department. You group sites into cost allocation groups and give each group a live SharePoint rate and an archive rate, and the page works out what each group, and each site in it, costs per month, plus how much archiving is saving it. See Cost Allocation for the page, and how to charge storage costs back to departments for the setup.
Billing History
Your Squirrel invoices, one row each: invoice number, amount total, the archived storage in terabytes that the invoice covers, and the date issued. A Send action re-sends any invoice to your billing contact - the address set as Email Billing in global settings.
Because each row pairs an amount with the storage it covers, this page is also the record of how your archived volume has grown month by month, which is the series behind the savings figures elsewhere in the dashboard.
When these numbers refresh
The analytics pages are not live. Knowing the cadence explains most "why doesn't this match?" questions:
| Numbers | Refresh |
|---|---|
| Archive and restore counts and volumes, total SharePoint size, percentage archived, total archived files | Nightly, around 3am |
| Site list, per-site sizes, label catalogue | Nightly, around 2am |
| Site size history | One point per calendar month - the current month's point keeps moving until month end |
| File Type Analytics and Site Activity | Weekly, on Sunday |
| Cost Allocation sizes | Live size per site nightly, around 2am; archived size per site daily. Rates and group membership apply immediately |
Two things worth knowing beyond the table. If the audit-log job overruns into the refresh window, that night's refresh is skipped and the numbers are a day stale rather than wrong - they will catch up on the next successful run. And archived storage figures are measured at original, uncompressed source size, which is the honest "space freed from SharePoint" number rather than the smaller figure Squirrel actually stores after compression.
Sites with no files at all do not appear in Site Activity.
Costs and Billing History are the exception to the table above: both are driven by the monthly invoice run rather than a nightly job, so they gain a new point when an invoice is issued and are otherwise static.
See also
- Reports - the 23 downloadable reports, including per-site CSVs.
- Site settings - per-site size and status, and where policies are set.
- Site custom policies - acting on what these pages tell you.
- Recycle Bin capture - capture activity is reported separately.
Need help? support@smikar.com.