
Chipmunk Dashboard for Microsoft 365 Archiving
1 min read · Last updated · Page version 5
The Chipmunk dashboard provides a real-time snapshot of all system activity, resource usage, job progress, and archiving metrics.
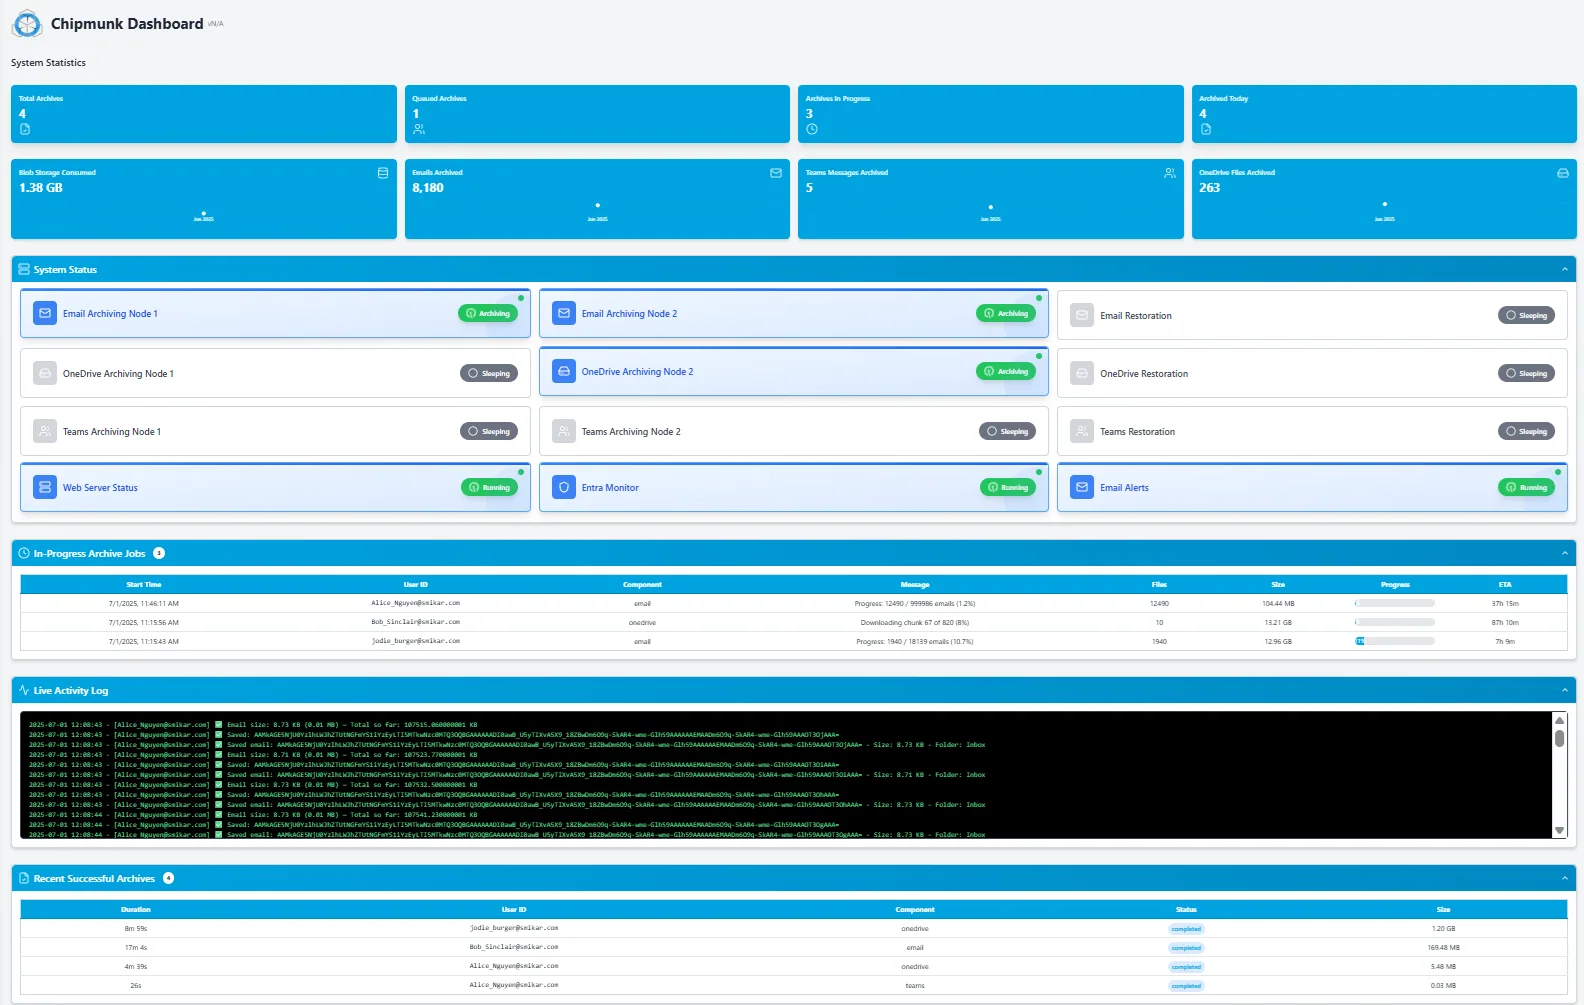
Dashboard Sections
| Section | Description |
|---|---|
| System Statistics | Displays the number of archived users, queued jobs, active archive sessions, and total storage consumed. |
| System Status | Shows the operational state of all Chipmunk components, including: |
| * Archiving Nodes (Email, OneDrive, Teams) | |
| * Restore Nodes | |
| * Entra Monitor | |
| * Web Server & Email Alert services | |
| In-Progress Archive Jobs | Lists jobs currently running. Displays start time, user ID, component (email, onedrive, etc), number of files, size, progress, and estimated time remaining. |
| Live Activity Log | Real-time logs from backup components - useful for observing archiving actions, errors, and system messages as they occur. |
| Recent Successful Archives | Displays a history of recently completed archives, including duration, user, size, and component. |
For deeper insights or troubleshooting, visit the Monitoring & Logs page.